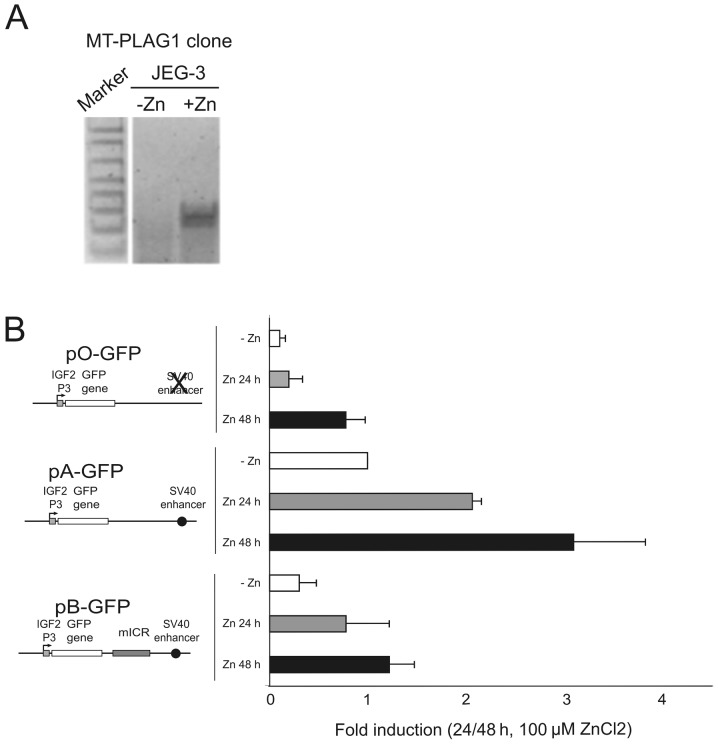
Figure 6.
Expression analyses of JEG-3 cells in a stable MT-PLAG1 clone and subsequent transient IGF2-P3-GFP transfection. (A) Semi-quantitative RT-PCR analysis showing increased PLAG1 expression in the Zn-treated MT-PLAG1 JEG-3 clone (+Zn) as compared to untreated cells (−Zn). B. The MT-PLAG1 JEG-3 cell-clone was transfected with IGF2-P3-GFP reporter constructs and analysis of GFP expression was performed using flow cytometry. The bars depict relative GFP expression after correlation to RFP expression (DsRed2) and indicate fold induction of GFP expression with non-induced (−Zn) and induced (+Zn) PLAG1 expression with different reporter constructs. The expression levels of GFP was analysed after both 24 and 48 h, showing an increased level of GFP expression after 48 h of induction. The expression level of the non-induced pA-GFP construct is set at 1 and is referred to as the basic state of enhanced expression. The error bars denote the SEM of three independent experiments.

