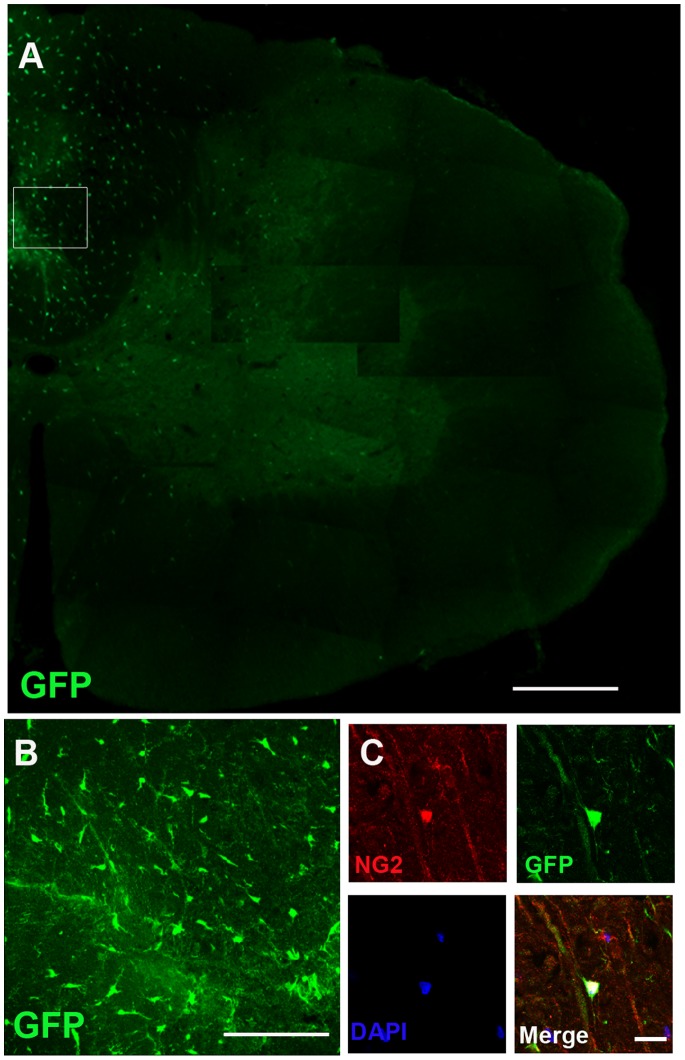
Figure 3. Distribution and morphology of Olig2+-GFP+-OPCs in irradiated spinal cord at four weeks after transplantation.
(A) GFP+ cells were observed and distributed in the damaged spinal cord. (B) At higher magnification of the boxed area from (A), the GFP+ cells exhibited typical bipolar OPC morphology. (C) Many grafted Olig2+-GFP+-OPCs co-expressed the OPCs marker NG2. Bar, 250 µm (A); bar, 100 µm (B); bar, 20 µm (C).

