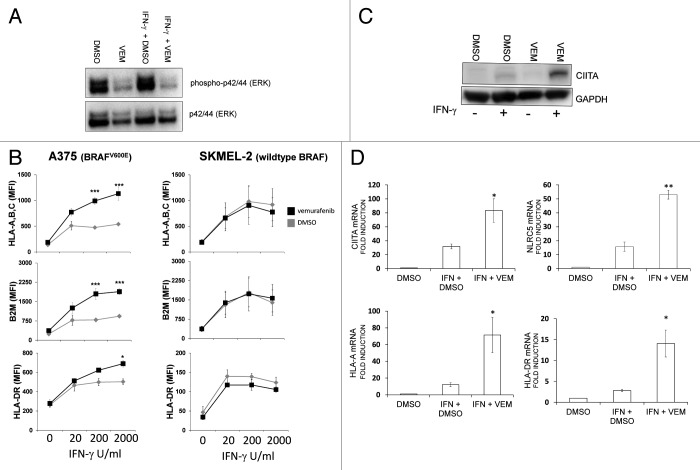
Figure 2. The enhancement of MHC induction by vemurafenib increases with escalating concentrations of IFNγ and is associated with increased CIITA and NLRC5 expression. (A) A375 cells were treated with vehicle (DMSO) or 10 μM vemurafenib (VEM), alone or in combination with 2000 U/mL IFNγ. Whole cell lysates were prepared 24 h later and the levels of phospho-ERK (T202/Y204) and total ERK were analyzed by immunoblotting. A representative result is shown. (B) A375 (BRAFV600E homozygous) or SKMEL-2 (bearing wild-type BRAF codon 600) cells were pretreated with vehicle (DMSO, gray diamonds) or 10 μM (vemurafenib) VEM 60 min prior to the addition of IFNγ at concentrations indicated along the x-axis. Cell surface MHC Class I (HLA-A, B, C), MHC Class II (HLA-DR) and β2-microglobulin (B2M) levels were analyzed 72 h later by flow cytometry. Values represent the average mean fluorescence intensity (MFI) from three independent experiments, and error bars represent SEM (*p < 0.05, ***p < 0.001, repeated measures ANOVA, as compared with DMSO-pre-treated cells exposed to the same concentration of IFNγ) (C) Protein lysates were isolated from A375 cells 72 h after treatment with vehicle (DMSO) or VEM, given as the only treatment or 60 min prior to the addition of 2000 U/mL IFNγ. GAPDH levels were monitored as a loading control. A representative immunoblot is shown. (D) Induction of HLA-A-, HLA-DR-, CIITA- and NLRC5-coding mRNA in A375 cells. A375 cells were pre-treated with vehicle (DMSO) or 10 μM VEM 60 min prior to the addition of 2000 U/mL IFNγ. Control cells were treated with vehicle (DMSO). mRNA levels were measured using quantitative real-time RT-PCR 72 hours later and are expressed as fold over vehicle-treated cells. Error bars represent SEM from at least 3 independent experiments. (*p < 0.05, **p < 0.01, two-tailed paired Student’s t-test, as compared with cells treated with IFNγ and pre-treated with DMSO)

An official website of the United States government
Here's how you know
Official websites use .gov
A
.gov website belongs to an official
government organization in the United States.
Secure .gov websites use HTTPS
A lock (
) or https:// means you've safely
connected to the .gov website. Share sensitive
information only on official, secure websites.
