
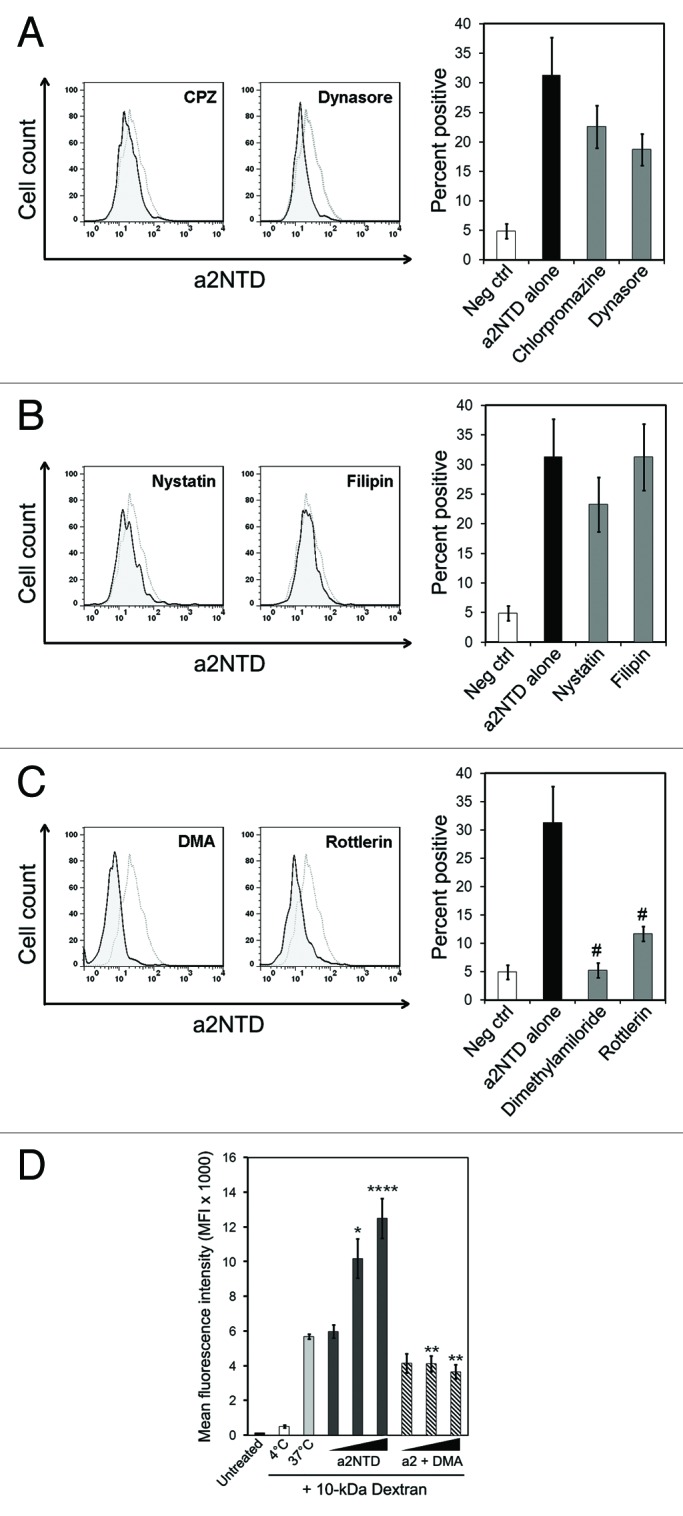
Figure 5. Inhibition of a2NTD endocytosis via trafficking inhibitors. (A–C) Peripheral blood mononuclear cells (PBMCs) were pre-incubated with the indicated trafficking inhibitors for 1 h at 37°C followed by the administration of 10 μg/mL a2NTD conjugated to Alexa Fluor 488 (a2NTD-AF488) for 1 additional h. Cell populations were analyzed by flow cytometry, upon gating on CD14+ events. Representative histograms for each trafficking inhibitor are reported. Dashed lines refer to cells incubated with a2NTD-AF488 alone, while solid lines depict cells incubated with trafficking inhibitor plus a2NTD. Bar graphs depict a2NTD-positive cells for clathrin-mediated endocytosis inhibitors (A), caveolin-mediated endocytosis inhibitors (B) and macropinocytosis inhibitors (C) (means ± SEM, n = 8, #p < 0.001, compared with a2NTD alone). (D) PBMCs were preincubated at 4°C or 37°C with 50 μg/mL 10 kDa dextran conjugated to Alexa Fluor 647 for 30 min. Some of the samples also received dimethylamiloride (DMA) for 30 min. Unconjugated a2NTD was then added (1–100 ng/mL) for 1 h at 37°C. followed by flow cytometry for the quantification of dextran-associated fluorescence. Columns report mean fluorescence intensity (MFI) values (means ± SE M, n = 4, *p < 0.01, ***p < 0.001, compared with cells maintained at 37°C, **p < 0.001, compared with cells receiving the same amount of a2NTD without DMA).