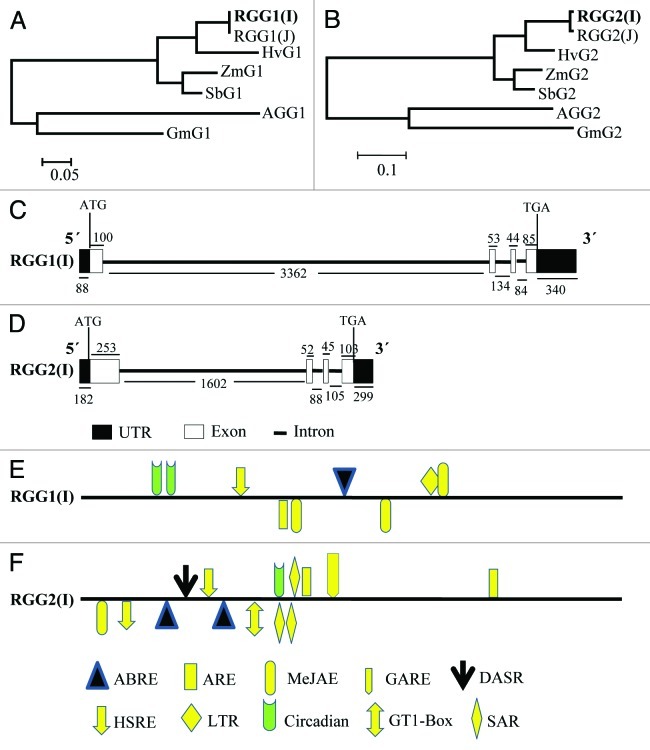
Figure 2. In silico analysis of RGG1(I) and RGG2(I). (A--B) Dendrogram showing evolutionary relationship of RGG1(I) (A) and RGG2(I) (B) with related proteins. The evolutionary history was inferred using the Neighbor-Joining method and evolutionary distances were computed using the Poisson correction method. These phylogenetic analyses were conducted in MEGA5. (C--D) The schematic representation of genomic organization (exon–intron organization) of the genomic sequence of RGG1(I) (C) and RGG2(I) (D) genes. Closed boxes represent exons, and lines between closed boxes represent introns. The dark boxes represent the UTRs. The position of ATG and TAA are marked. The numbers below the lines and the above boxes indicate the sizes (bp) of introns, UTR and exons, respectively. (E--F) Stress-responsive cis-elements and phytohormones responsive elements in the 2 kb 5′-upstream regions of RGG1(I) (E) and RGG2(I) (F). The lines represent 5′-upstream regions of RGG(I) genes. The elements located in the positive strand are above the lines, while those in the reverse strand are indicated below the line. ABRE, abscisic acid responsive element; ARE, auxin responsive factor (TGA-box; MeJAE, methyl jasmonate responsive element; GARE, gibberellic acid-responsive element; DASR, defense and stress responsive element; GT1-Box; SAR, salicylic acid responsive element; HSRE, heat stress responsive element; LTR, Low temperature responsive element.

An official website of the United States government
Here's how you know
Official websites use .gov
A
.gov website belongs to an official
government organization in the United States.
Secure .gov websites use HTTPS
A lock (
) or https:// means you've safely
connected to the .gov website. Share sensitive
information only on official, secure websites.
