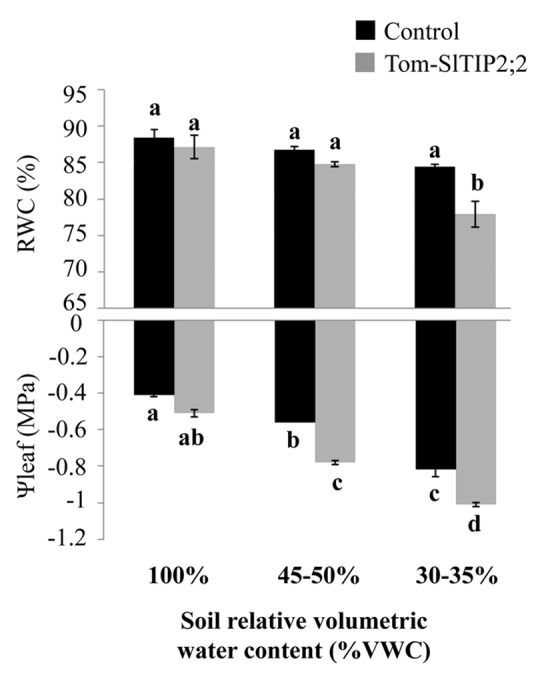
Figure 1. Comparison of midday leaf water potential (Ψleaf) and leaf relative water content (RWC) of Tom-SlTIP2;2 and control plants at different levels of relative soil volumetric water content (VWC). Two independent Tom-SlTIP2;2 lines (Sade et al., 2009)8 and control plants were subjected to drought and the decreasing soil VWC was monitored using a soil moisture probe (10HS, Decagon). (A) Midday leaf Ψleaf and (B) leaf RWC were measured at three different VWC levels (100%,~50%,~30%) using a pressure chamber (ARIMAD3000, MRC). Different letters above the columns represent significant differences (Tukey-Kramer test, p < 0.05). Data points are means ± SE (n = 6).
