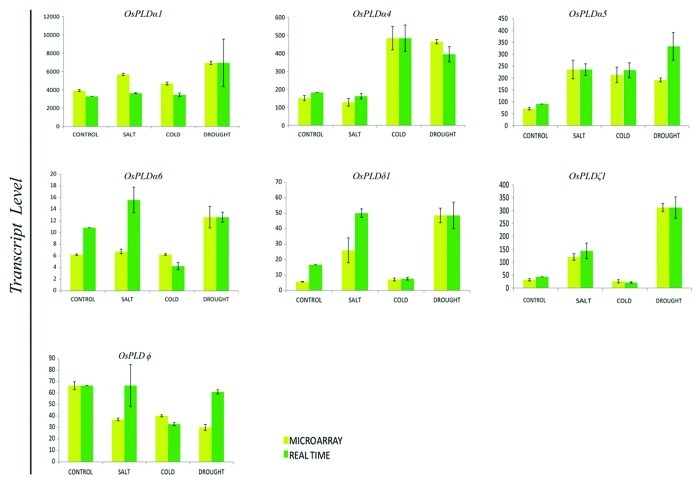
Figure 5. Validation of microarray expression profiles for differentially expressing PLD genes by quantitative RT-PCR. Two and three biological replicates were analyzed by real time PCR and microarray, respectively. Standard error bars have been shown for both microarray and real time PCR data. Y-axis represents raw expression values from microarray and normalized expression value from real time PCR and X-axis shows different experimental conditions.

An official website of the United States government
Here's how you know
Official websites use .gov
A
.gov website belongs to an official
government organization in the United States.
Secure .gov websites use HTTPS
A lock (
) or https:// means you've safely
connected to the .gov website. Share sensitive
information only on official, secure websites.
