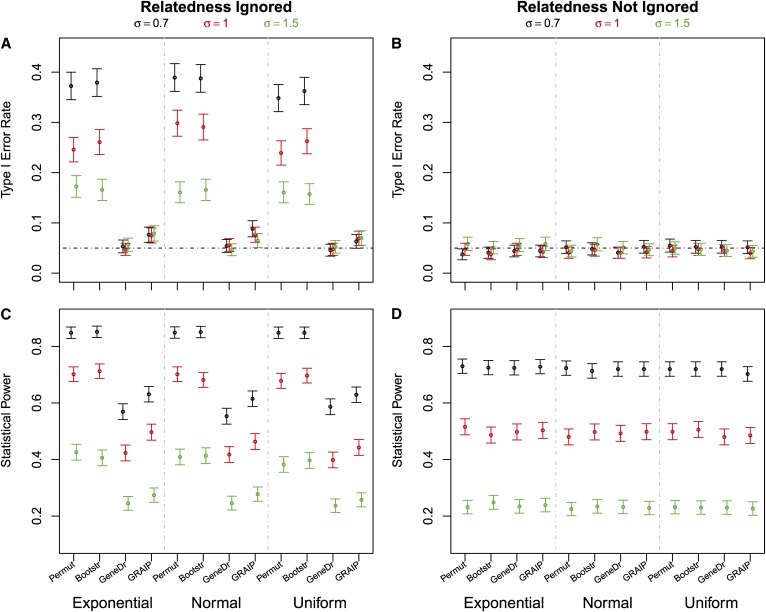
Figure 1.
Type I error rates and statistical power. Type I error rates (A and B) and statistical power (C and D) estimated at genome-wide significance level 0.05 by each of the following methods: permuting genotypic data (Permut), bootstrapping phenotypic data (Bootstr), gene dropping (GeneDr), and GRAIP. The distribution of the residual was exponential, normal, or uniform, each with a standard deviation 0.7, 1, or 1.5.

