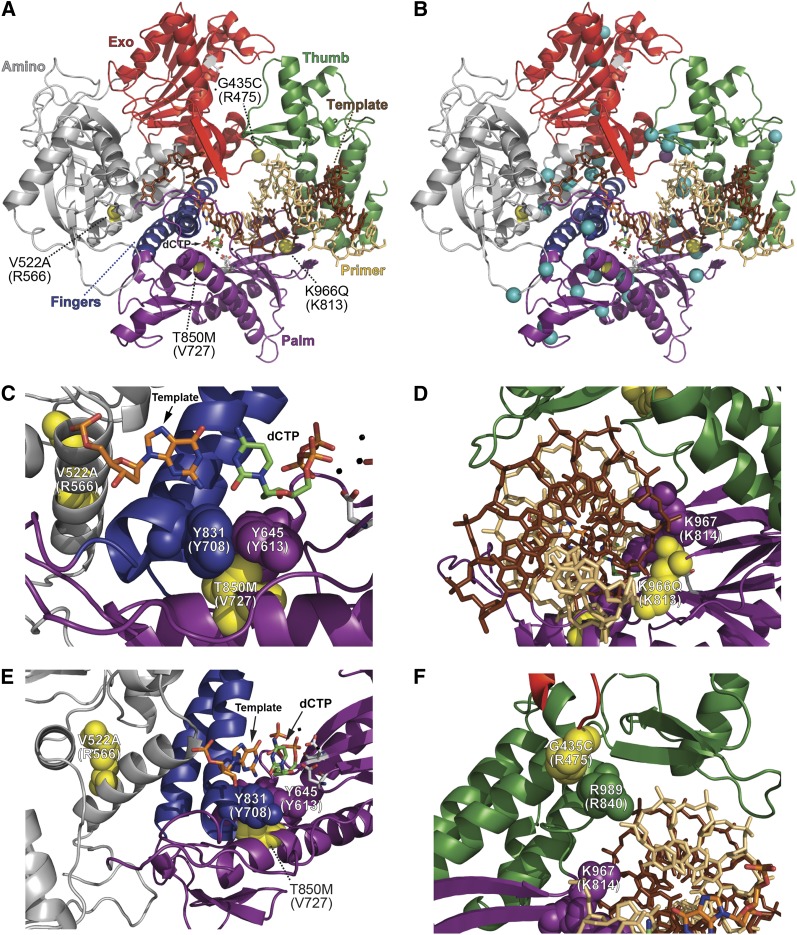
Figure 7.
Locations of Pol ε eex amino-acid substitutions mapped onto the Pol δ structure. (A) Overall distribution of Pol ε eex amino-acid substitutions. The catalytic subunit of yeast Pol δ is depicted as a ribbon diagram with the following color-coded elements: exonuclease domain, red; thumb domain, green; fingers domain, blue; palm domain, purple; amino domain, gray; DNA template strand, brown sticks; primer strand, tan sticks; catalytic carboxylate residues in the polymerase and exonuclease active sites, gray CPK sticks; metal ions, small black spheres; incoming dCTP, green CPK sticks; template G nucleotide, orange CPK sticks. Locations of eex-encoded changes are shown as yellow spheres and labeled by the Pol ε amino-acid substitution with the corresponding Pol δ residue in parentheses. The A1153D substitution is not pictured because it falls in a region where the Pol δ structure is unknown. (B) Locations of Pol ε eex substitutions (yellow spheres) relative to Pol δ eex substitutions (aqua spheres; see (Herr et al. 2011a). The purple sphere at the Exo-Thumb interface is Pol ε G435C, which aligns with Pol δ R475I/G. (C, D, E, and F) Close-up depictions of Pol ε eex substitutions. Important residues are highlighted as space-filling spheres, with yellow indicating positions corresponding to Pol ε eex substitutions. Structure of S. cerevisiae Pol δ is from Swan et al. (2009) (Protein Data Bank accession code 3IAY).

