Figure 2.
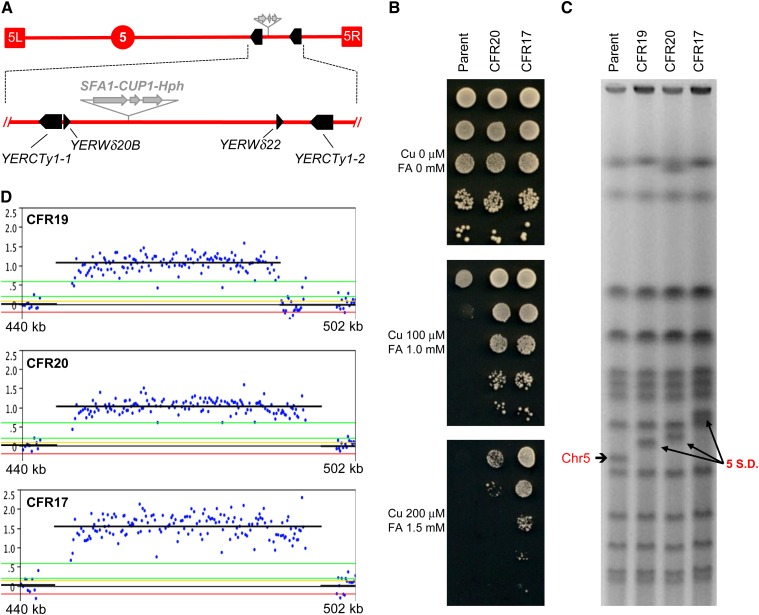
Identification of chr5 amplifications in haploids: Segmental duplications. (A) Schematic representation of the region of chr5 where the SFA1–CUP1 CNV reporter was inserted (shaded arrows). The reporter also contained a drug-resistance marker, either Hph (hygromycin B), as shown, or Kan (G418–geneticin). Terminal boxes correspond to the left and right chr5 telomeres (5L and 5R, respectively), and the circle represents CEN5. Bottom, expanded view of the region involved in segmental amplifications (440–502 kb), showing full-length Ty1 elements as solid arrows and solo LTRs as arrowheads according to their orientation. (B) FA/Cu-resistance phenotypic differential between the parental haploid strain (JAY372) containing one copy of the reporter and CFR clones carrying two (CFR20) or three (CFR17) copies. Serial dilutions of these strains were spotted on plates containing Cu and FA at the concentrations indicated to the left. (C) PFGE showing the karyotypes of the parental haploid and three CFR clones carrying different segmental amplifications on chr5. The parental size chr5 is indicated to the left and the segmental amplifications are indicated to the right (5 SD). (D) Detailed view of chr5 array-CGH plots showing the Log2 Cy5/Cy3 signal intensity (copy number) and the rearrangement breakpoints for the three CFRs from C. The plots are aligned directly below to the expanded section of A such that the breakpoints correspond to the repeat sequences. Each blue dot corresponds to the signal of a specific probe in the region. The black horizontal lines correspond to the average signal for probes in a region of amplification. Neutral signal corresponds to no copy-number change (1× in haploids); positive signals corresponding to two copies (∼1.0) or three copies (∼1.5) are shown.

