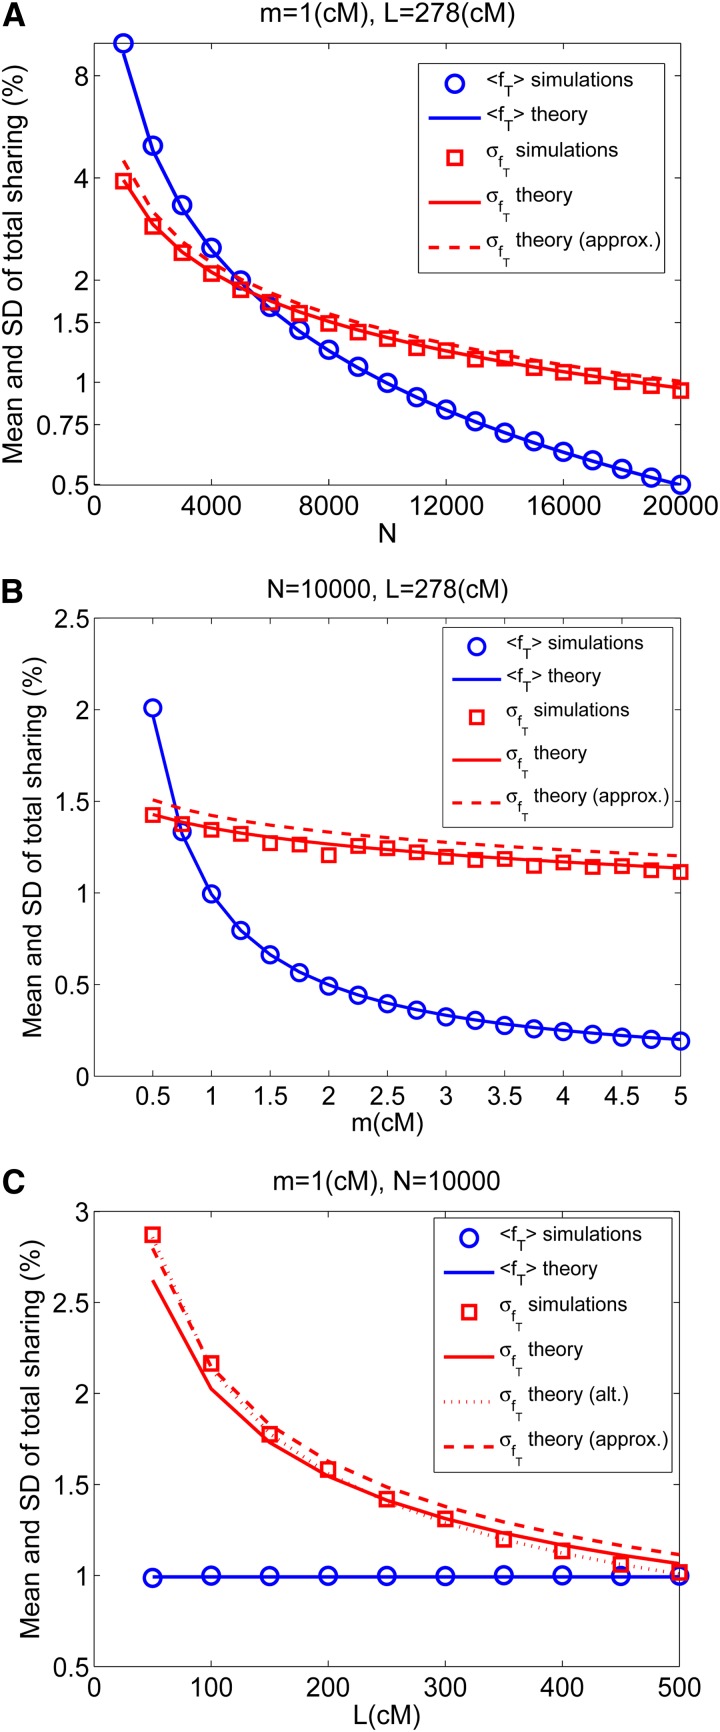
Figure 2.
The mean and standard deviation of the total sharing. For each parameter set, we used the Genome coalescent simulator to generate a number of genealogies (from a population of size N and for one chromosome of size L) and then calculated the lengths of IBD shared segments between random individuals. Each panel presents the results for the mean and standard deviation (SD) of the total sharing, that is, for each pair, the total fraction (in percentages) of the genome that is found in shared segments of length ≥m. Simulation results are represented by symbols and theoretical results by lines (Equation 4 for the mean and Equation 12 for the SD are plotted in solid lines; the approximate form for the SD, Equation 15, is shown in dashed lines). (A) We fixed m = 1 cM and L = 278 cM [the size of the human chromosome 1 (International HapMap Consortium 2007)] and varied N. (B) Same as A, but with fixed N = 10,000 and varying m. (C) Fixed N and m and varying chromosome length L. In C, we also plotted the result of an alternative, more elaborate calculation of the variance (dotted line; see File S1, section S1.3).

