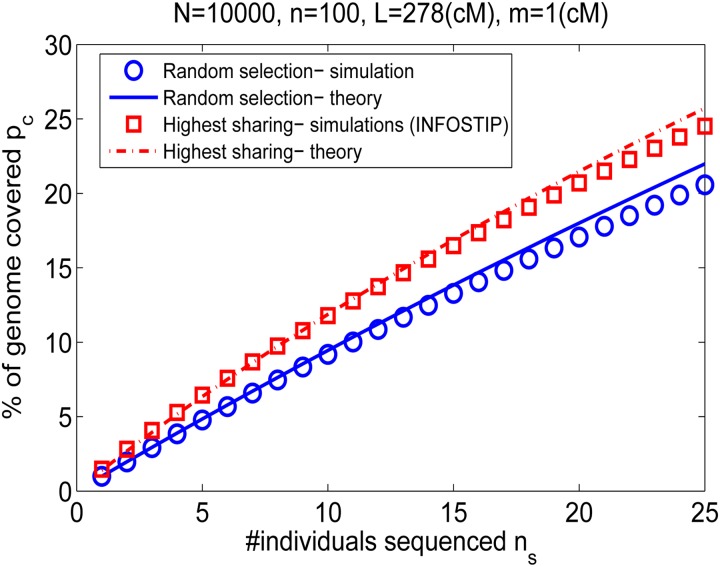
Figure 7.
Coverage of genomes not selected for sequencing by IBD shared segments. We simulated 500 Wright–Fisher populations with N = 10,000, n = 100, and L = 278 cM and searched for IBD segments with length ≥m = 1 cM. For each plotted data point, we selected ns individuals either randomly or using Infostip. Then, for each of the n − ns individuals not selected, we calculated the fraction of their genomes shared with at least one selected individual. We plotted (symbols) the average coverage over all individuals in all populations. Lines correspond to theory: Equation 32 for random selection and Equation 34 for Infostip selection.

