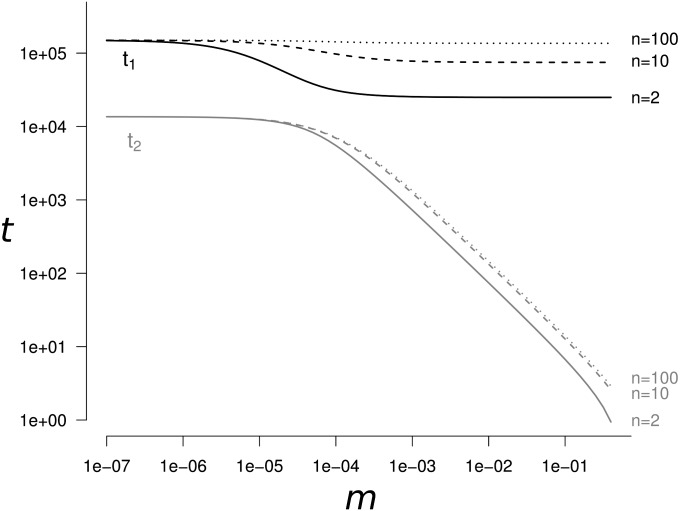
Figure 1.
The time (in number of generations) t1 to reach genetic diversity equilibrium and the length of the transient dynamics period t2 as a function of the migration rate m. The solid line corresponds to n = 2 populations, the dashed line to n = 10, and the dotted line to n = 100. t1 is always at least one order of magnitude higher than t2. This separation of the two periods becomes even greater when . Parameter values are N = 2500, μ = 10−5, α = 5%.

