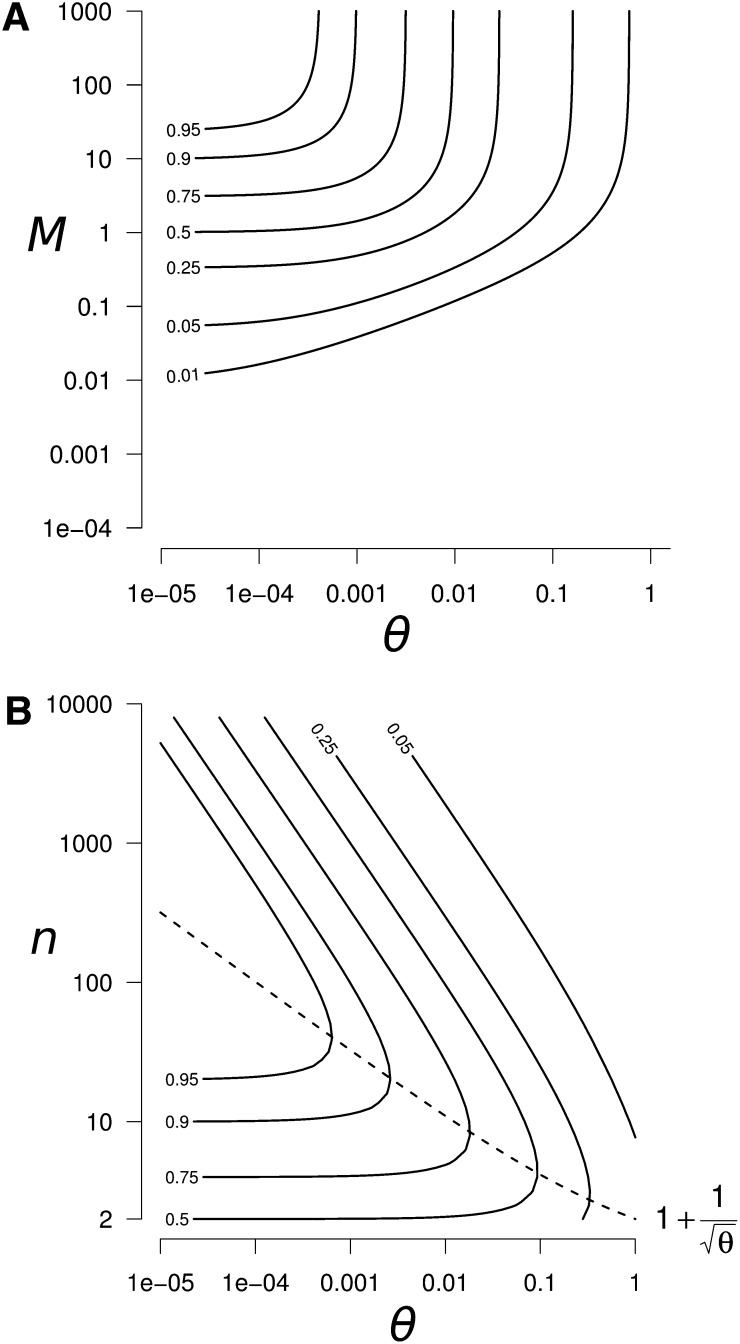
Figure 4.
Peak of within-population genetic diversity ΔHs generated by a reconnection event. (A) Contour plot of ΔHs as a function of θ and M, for n = 100. We can clearly see the highest peak of diversity in the high M and low θ region. (B) Contour plot of the peak of genetic diversity after a reconnection event as a function of θ and n, for M ≫ 1 (high M region identified in A). In the high M region, the within-population diversity peak ΔHs and the between-population diversity excess ΔHb are equal. The dashed line represents the number of populations which maximizes the peak of diversity .

