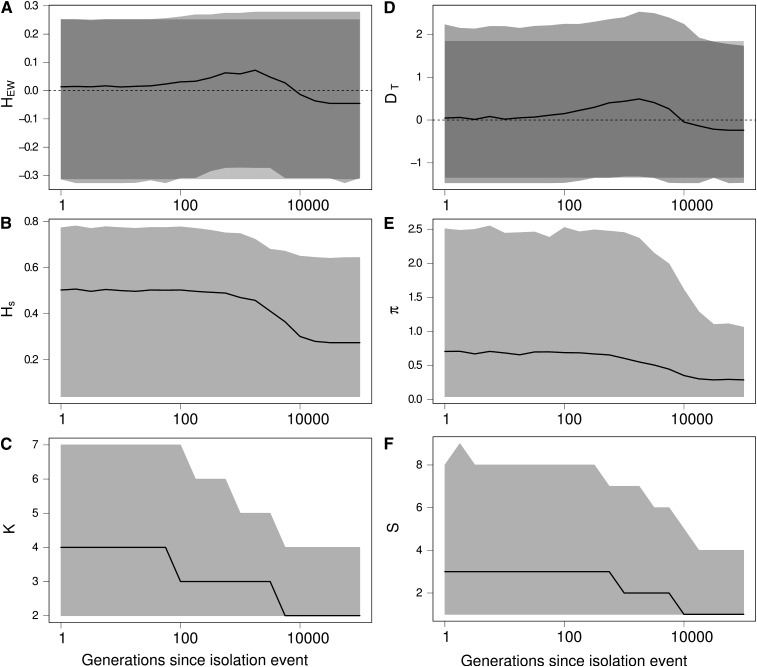
Figure 5.
Effect of an isolation event on Ewens–Watterson and Tajima’s D neutrality tests and on related summary statistics. (A) Ewens–Watterson statistics (HEW), (B) genetic diversity (Hs), (C) number of alleles (K), (D) Tajima’s D (DT), (E) number of pairwise differences (π), and (F) number of segregating sites (S). For each statistics, the solid line represents the median of the distribution and the light shading represents the 97.5 and 2.5% quantiles of the distribution as a function of the number of generations t after the isolation event. Dark shading in A and D represent the expected distribution of the statistics in an isolated population at equilibrium. Values of HEW and D after an isolation event are skewed toward positive values (signature of a bottleneck or directional selection), while there was no change in the size of the population. K and S decrease more quickly than Hs and π, because rare alleles are eliminated by genetic drift more quickly than common alleles. Coalescence simulations of a 1-kb locus with a mutation rate of 2 × 10⁻⁸/bp, where four populations of size 2500 are isolated; 5000 replicates.

