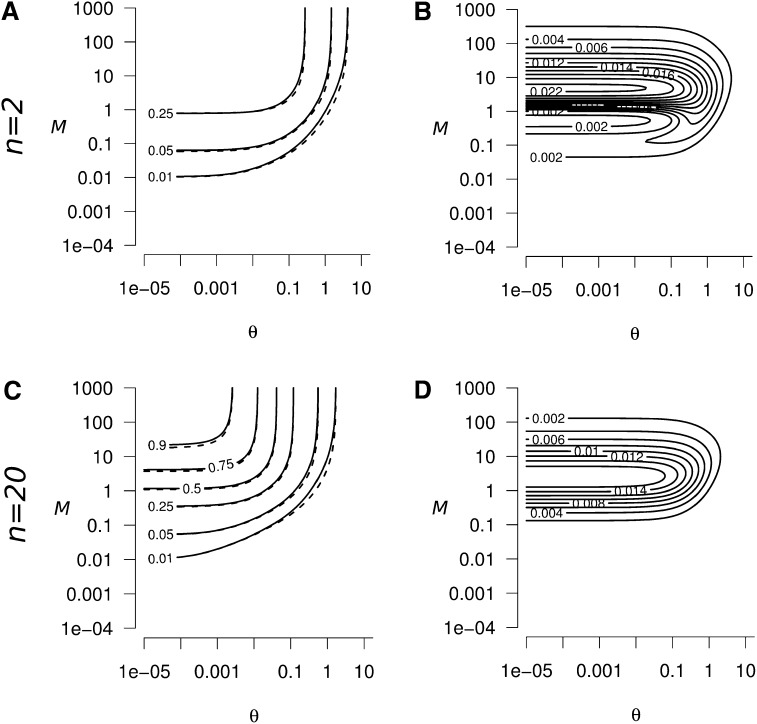
Figure B1.
(A and C) Exact (solid lines) and approximate (dashed lines, from Equation 9) values of the peak of genetic diversity ΔHs, as a function of the strength of migration (M) and mutation (θ). In both A and C, the exact and approximate values of ΔHs are very close. (B and D) Absolute error when using Equation 9 to approximate ΔHs, as a function of M and θ. The maximum absolute error is reached when M ≃ 5 and θ < 1 in both B and D. The error decreases when M ≫ 5 or M ≪ 5. The absolute error increases when n decreases, but remains weak: (B) the maximum absolute error is 0.025 for n = 2, and (D) 0.018 for n = 20. Consequently, Equation 9 is a good approximation for the peak of genetic diversity whatever the parameter values of θ, M, and n considered.

