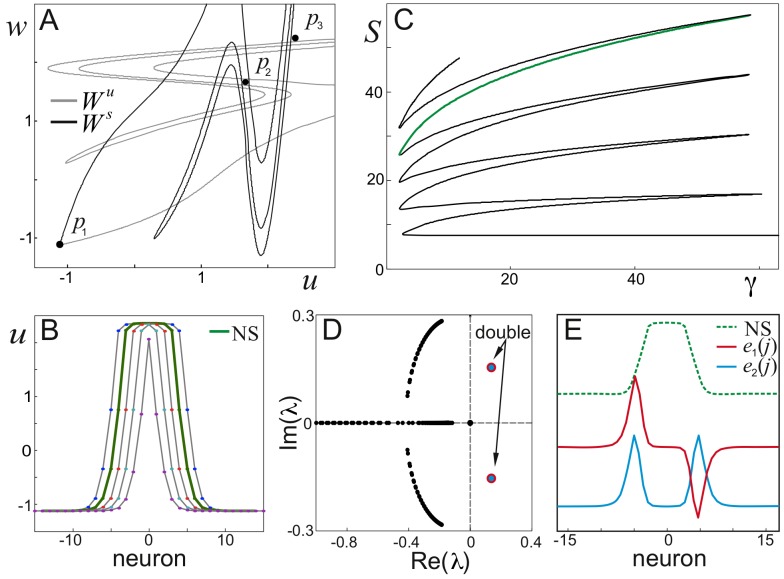
Figure 4. Analysis of the nucleating solution leading to different scenarios of wave collisions.
A) Stable and unstable manifolds to the saddle point  in the map (4). Black dots mark three fixed points (
 ,
,  ). B) Spatial profiles of several homoclinic orbits (NS stands for nucleating solution). C) Bifurcation diagram. Each branch corresponds to a homoclinic orbit in the map (4). D) Eigenvalues of the NS. Two pairs have positive real value. E) NS and real parts of the eigenvectors corresponding to the eigenvalues with positive real part: asymmetric,
  , and symmetric,
  .
.

