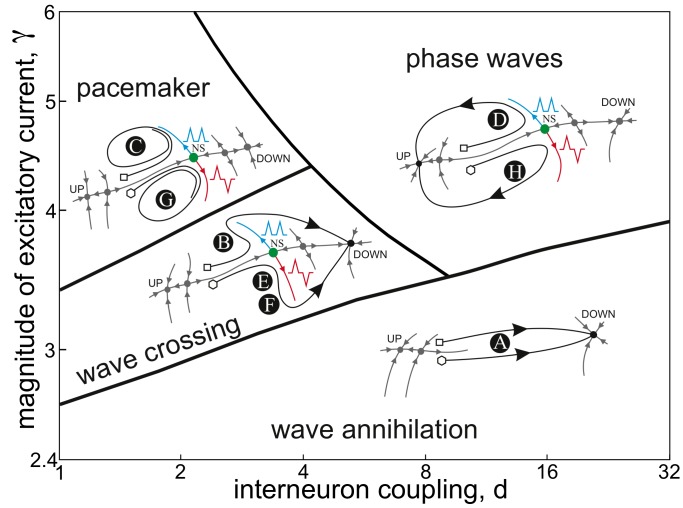
Figure 5. Bifurcation diagram and sketches of trajectories describing different scenarios of wave collisions in the chain of bistable-excitable neurons.
In each inset: Square and diamond mark initial conditions for symmetric and asymmetric collisions, respectively; Green dot corresponds to the nucleating solution (NS); Blue and red unstable manifolds represent development of symmetric and asymmetric perturbations (see also Fig. 0E); Letters in black circles correspond to scenarios shown in Fig. 3.

