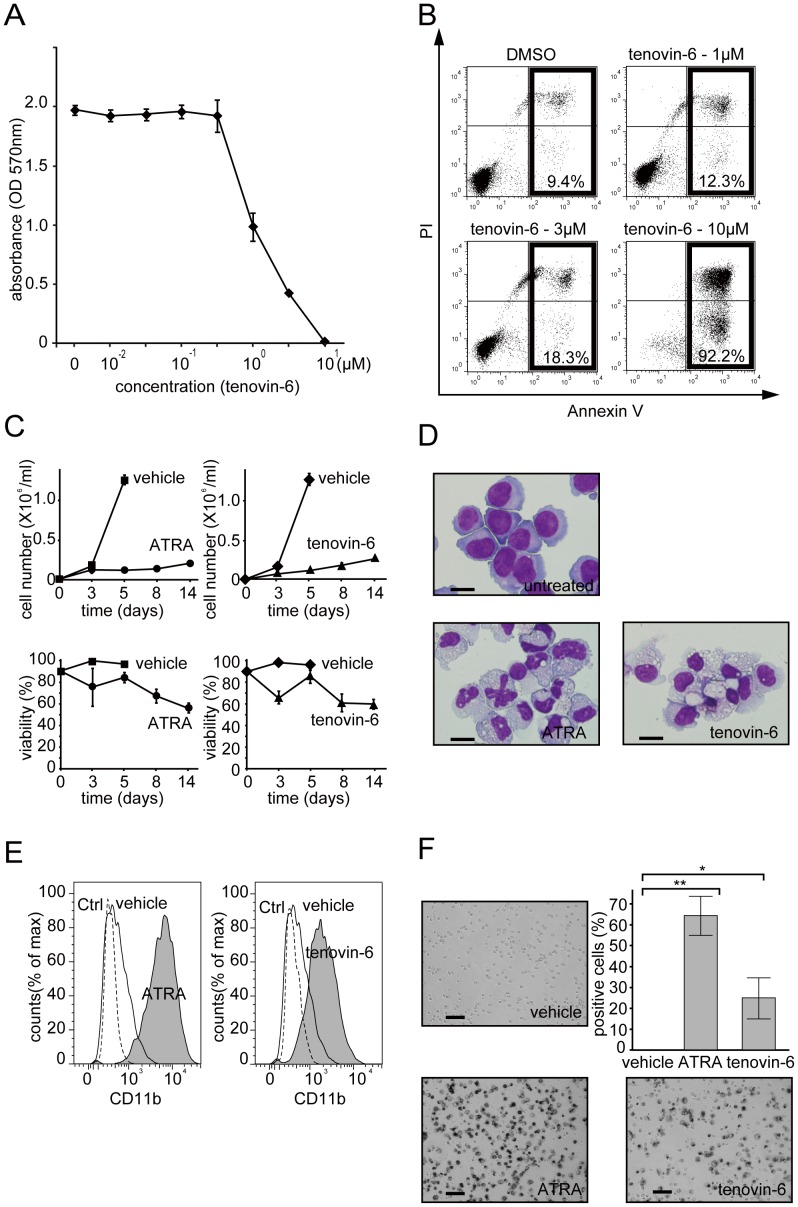
Figure 1. Tenovin-6 inhibits cell proliferation, induces apoptosis, and promotes granulocytic differentiation in NB4 cells.
(A) NB4 cells were cultured for 48 hours in the presence of tenovin-6 (0.01, 0.03, 0.1, 0.3, 1, 3, and 10 µM) or vehicle (DMSO). Cell proliferation was monitored by MTT assay. The results are presented as means ± SD of 6 replicates. Representative data are shown. Experiments were performed in triplicate, and the error bars show mean ± SD. (B) Annexin-V/PI assay was performed after 24 hours treatment with the indicated amount of tenovin-6 or DMSO. The population of cells undergoing apoptosis is indicated. Note that despite the strong inhibition of cell proliferation in Figure 1A, the induction of apoptosis by 3 µM tenovin-6 is low. (C) A long-term culture experiment on tenovin-6-treated NB4 cells was performed. Cells were treated with tenovin-6 (3 µM), ATRA (1 µM), DMSO (vehicle for tenovin-6), or ethanol (vehicle for ATRA). Live cells were counted and are depicted in graphs on the top. Dead cell numbers were determined by trypan blue dye inclusion. The calculated viability is depicted in graphs on the bottom. Representative data are shown. Experiments were performed in triplicate, and error bars show mean ± SD. (D) Morphologic alternation was examined 7 days after treatment with 3 µM of tenovin-6 or 1 µM of ATRA by Wright-Giemsa staining. Untreated NB4 cells were used as a control. Either tenovin-6- or ATRA-treated NB4 cells presented highly differentiated morphologies (eg, lower nucleus:cytoplasm ratio). Scale bar represents 20 µm. (E) FACS analysis of tenovin-6 (3 µM)- or ATRA (1 µM)-treated NB4 cells (gray shadow) using PE-CD11b. These cells had increased expression levels of CD11b compared to untreated cells (black line). The PE-IgG control profile is drawn as a dashed line. (F) NBT reduction capacity in ATRA-, tenovin-6-, or DMSO-treated NB4 cells was examined. The captured images were taken 5 days after treatment. The black staining indicates that cells possess NBT reduction capacity, one of the signature properties of matured granulocytes. Stained cells counted at day 5 are depicted in the graph. Counting was performed in 3 independent microscope fields that covered at least 200 cells each. Error bars show mean ± SD (n = 3). *P<0.05. **P<0.01.

