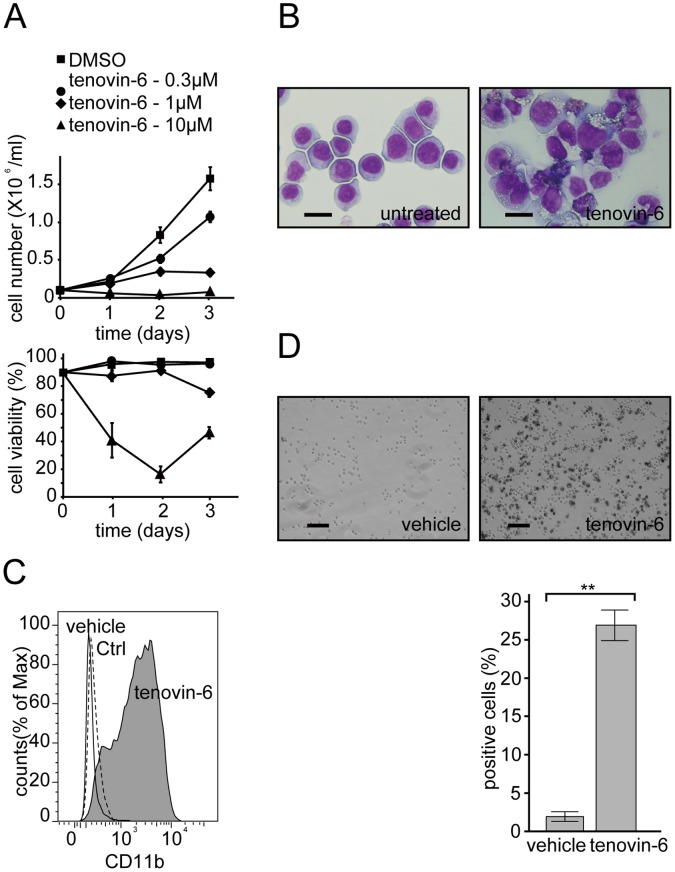
Figure 3. Tenovin-6 induces granulocytic differentiation in the PML-RAR.
-α-negative myeloblastic leukemia cell line HL-60. (A) HL-60 cells were cultured in the presence of the indicated amount of tenovin-6 or DMSO (vehicle). Total viable cell counts (upper graph) and viabilities (lower graph) are depicted. Note that at 1 µM, cell proliferation was strongly inhibited, with relatively high viability (75%). Representative data are shown. Experiments were performed in triplicate, and error bars show mean ± SD. (B) Tenovin-6 (1 µM)-treated HL-60 cells show a more differentiated cell morphology in Wright-Giemsa staining. (C) FACS analysis of tenovin-6 (3 µM)-treated HL-60 cells (gray shadow) using PE-CD11b. The cells demonstrated increased expression levels of CD11b compared with untreated cells (black line). The PE-IgG control profile is drawn as a dashed line. (D) Tenovin-6 (1 µM)-treated HL-60 cells became positive for NBT reduction. Counting was performed as described in Figure 1F. Error bars show mean ± SD (n = 3). **P<0.01.

