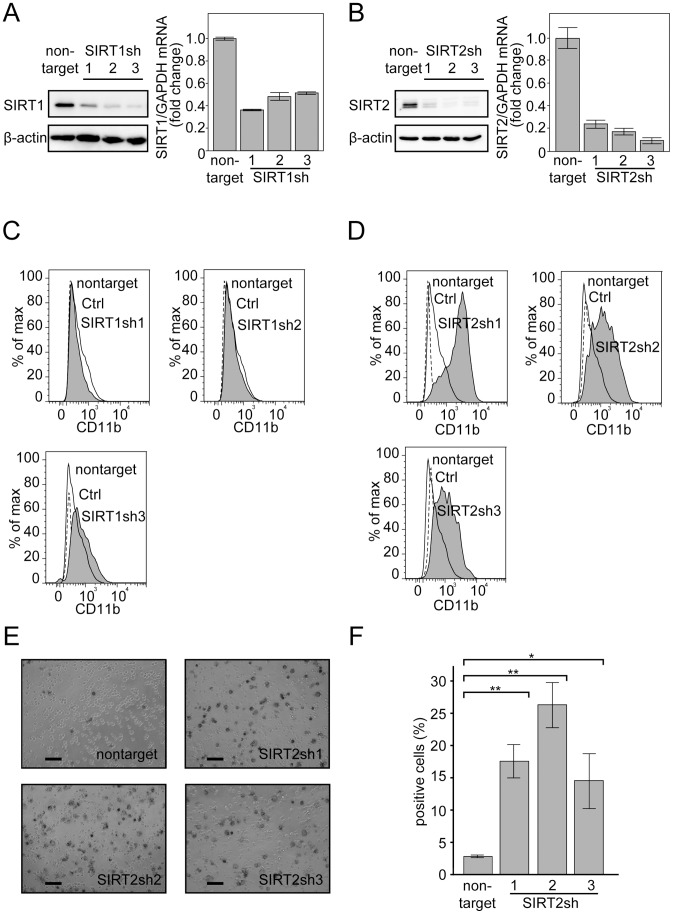
Figure 5. SIRT2 knockdown induces granulocytic differentiation in NB4 cells.
(A, B) Knockdown efficiency was examined by immunoblotting and RT-PCR for SIRT1 (A) and SIRT2 (B). β-Actin and GAPDH were used as controls for immunoblotting and RT-PCR, respectively. 7.5 (A) or 18 µg (B) extracts were loaded in each lane for immunoblotting. Three independent sequences of shRNAs against each gene were used. The RT-PCR results were quantified by the comparative Ct method. Non-target control values were set as 1, and relative fold values are depicted in the graph. Representative RT-PCR data are shown. Experiments were performed in triplicate, and error bars show mean ± SD. (C, D) Granulocyte marker CD11b expression was monitored by FACS. SIRT1-knockdown (C) and SIRT2-knockdown (D) cells (gray shadow) were compared with control cells expressing non-targeting shRNA (black line). PE-conjugated IgG control experiments were performed and are indicated as a dashed line. (E) NBT reduction assays against SIRT2-knockdown cells and control cells (non-targeting shRNA) were performed. The captured images were 2 days after treatment. (F) Cells with NBT reduction capacity were counted and are depicted in the graph. Counting was performed as described in Figure 1F. Error bars show mean ± SD (n = 3). *P<0.05. **P<0.01. Note that although we performed serial infections of NB4 cells, the infection efficiency was approximately 70%, judging from the proportion of cells infected with the control virus bearing a GFP expression construct (not shown). The subsequent assay was performed without establishing a cell line using a selection marker in the viral vector. Therefore, the analyzed population contains cells not expressing the shRNAs, so the readings in these assays were under-valued due to contamination by cells not bearing shRNAs.

