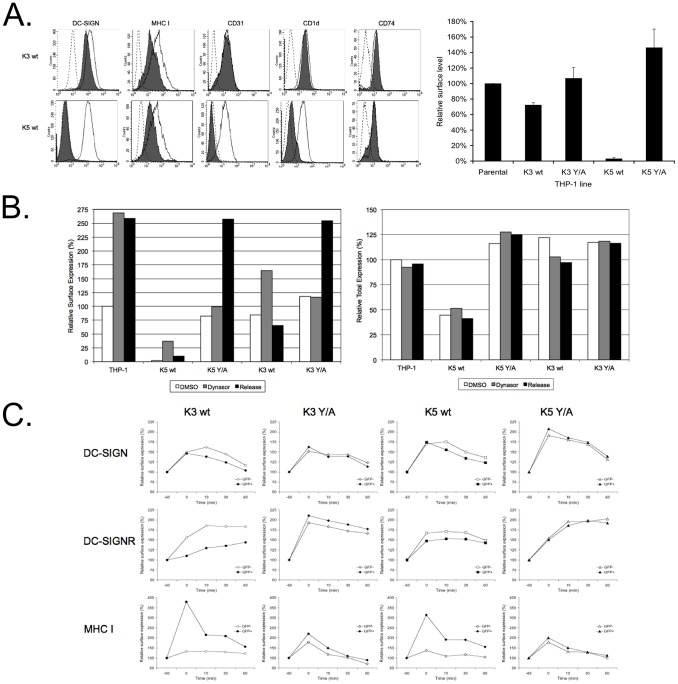
Figure 4. Wild-Type K5 and K3 cause enhanced endocytosis of DC-SIGN, but not DC-SIGNR.
A) Empty vector transduced THP-1 cells, as well as K3 wt, K3 Y/A, K5 wt and K5 Y/A expressing stable lines, were stained for the indicated surface markers. Histograms on the left show staining of these markers (filled lines) overlayed with isotype control (dashed lines) or with vector transduced THP-1 cells (open lines). As shown in the right bar graph, surface levels of DC-SIGN were determined by flow cytometry and mean channel fluorescence was normalized to vector transduced THP-1 cells. Data shown are an average of three independent experiments with error bars showing standard deviation. B) Indicated THP-1 cells lines were treated for 60 minutes with 80 µM dynasore or mock treated with DMSO at 37°C. Upon dynasore removal, cells were chased for 30 min at 37°C in complete medium and endocytosis was stopped by adding sodium azide to all samples. Half of the samples were stained for DC-SIGN surface levels on ice (left panel), while the other half was stained for total DC-SIGN levels after paraformaldehyd fixation and saponin permeabilisation (right panel). Mean channel fluorescence for DMSO treated vector transduced cells was set to 100%. The data shown are representative of three independent experiments. C) 293 cells stable expressing DC-SIGN or DC-SIGNR were transiently transfected with 4 µg GFP-tagged K3 wt, K5 wt or the Y/A mutant of either protein. After 36 to 48 hours, cells were subjected to dynasore treatment and release similar to that described in B except that three release time points were assayed. Mean channel fluorescence for surface DC-SIGN, DC-SIGNR, and MHC I were determined by flow cytometry for GFP positive (filled symbols) as well as GFP negative (open symbols) populations. For normalization, DMSO treated cells were set to 100 percent (indicated by the −60 min time point) and relative fluorescence following dynasore treatment (indicated by the 0 min time point) and release (indicated by the 10 min, 30 min and 60 min time points) was calculated. Data presented are representative of three independent experiments.

