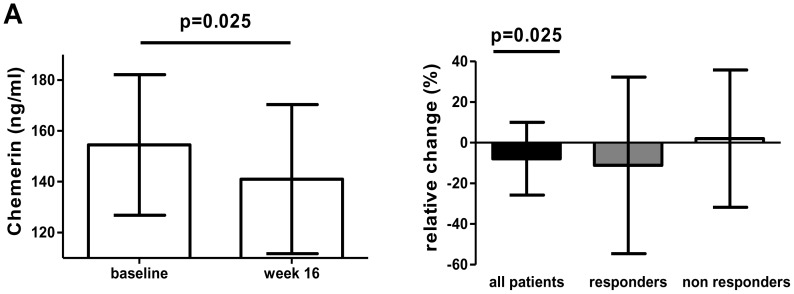
Figure 1. Changes in chemerin serum levels 16 weeks after initiation of treatment with adalimumab.
(A) Absolute change in all patients (n = 49). Data are represented as mean values with standard deviation. (B) Relative change for all patients (n = 49), EULAR responders (n = 38) and EULAR non- responders (n = 11). Data are presented as mean values with standard deviation.

