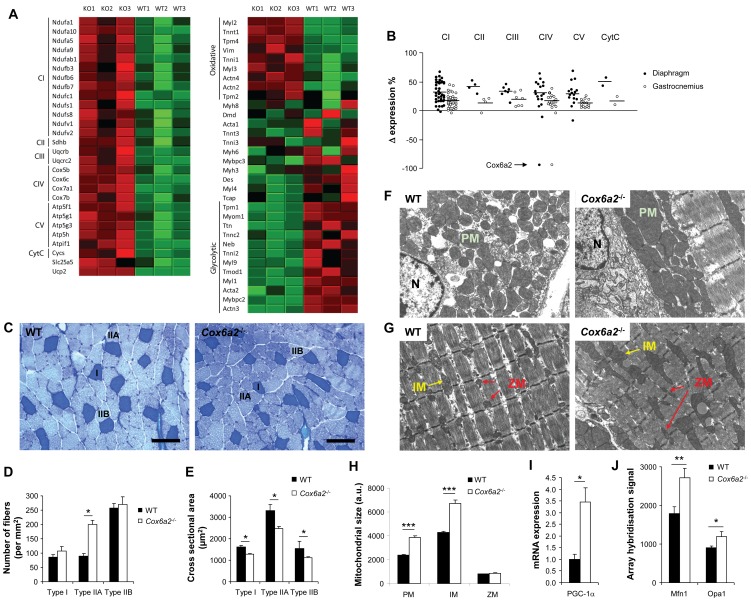
Figure 6. Fiber type switch and increased mitochondrial size in muscles of Cox6a2 −/− mice.
(A) Heat maps of top subsets of genes of a Gene Set Enrichment Analysis of gene expression in diaphragm of WT versus Cox6a2 −/− mice on a regular diet (n = 3). Genes were ranked according to their signal-to-noise ratio. Left: Electron transport chain genes. Right: Striated muscle contraction genes. Red color indicates high expression, green color indicates low expression. KO: Cox6a2 −/−, (B) Relative changes in expression of genes of the electron transport chain in diaphragm and gastrocnemius muscle of Cox6a2 −/− mice compared to WT mice. Horizontal bars indicate mean difference in expression. For complex IV, Cox6a2 was not taken into account for calculation of the mean difference in expression. CI, complex I; CII, complex II; CIII, complex III; CIV, complex IV; CV, complex V (ATP synthase); CytC, cytochrome c, (C) Fiber typing of gastrocnemius muscle by a metachromatic ATPase assay. ATPase activity stains type I fibers dark blue, type IIA fibers light blue, and type IIB fibers very light blue. Representative images of fiber typing in the gastrocnemius muscle from WT and Cox6a2 −/− mice are shown. Scale bar = 100 µm. I, IIA, and IIB refer to type I, type IIA, and type IIB fibers, (D) Quantification of muscle fiber types in gastrocnemius muscle of WT and Cox6a2 −/− mice (n = 20–30). Note the increase in the total number of fibers in gastrocnemius muscle from Cox6a2 −/− mice, (E) Cross-sectional area of different fiber types in gastrocnemius of WT and Cox6a2 −/− mice (n = 30–60), (F–G) Transmission electron micrographs of WT and Cox6a2 −/− diaphragm. Perinuclear (F) and intermyofibrillar mitochondria (G) are shown. N: nucleus; M: mitochondrion; IM: intermyofibrillar mitochondria; Z: small intermyofibrillar mitochondria located near Z-discs, (H) Quantification of the mitochondrial size of the diaphragm of WT and Cox6a2 −/− mice, (I) Pgc-1α mRNA expression in diaphragm of WT and Cox6a2 −/− mice (n = 3) was measured using qRT-PCR, (J) mRNA expression signals for Mfn1 and Opa1 as measured by microarrays.

