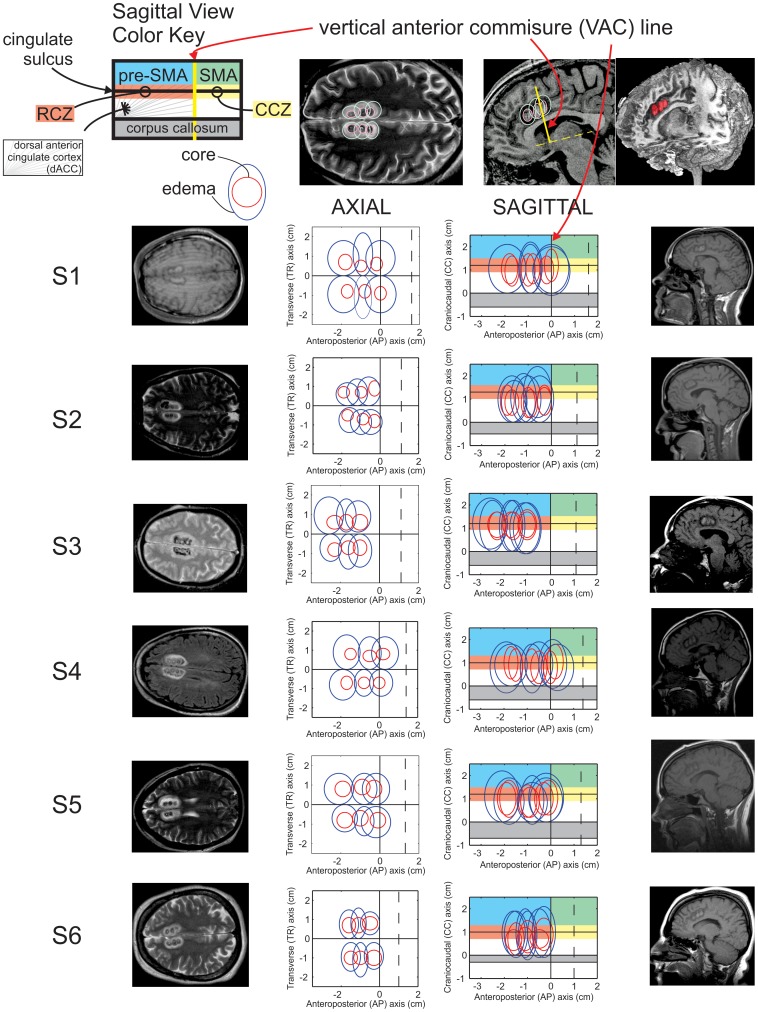
Figure 2. RF ablation zones for all subjects in axial and sagittal projections.
Core ablation foci (red) and surrounding edema (blue) are approximated as concentric ovals. Anteroposterior (AP) measurements are made relative to the VAC line. Transverse (TR) measurements are made relative to the interhemispheric fissure. Craniocaudal (CC) measurements are made relative to the superior margin of the corpus callosum. The extent of motor areas, shaded in color, is only approximate. The vertical dotted line (sagittal) indicates the paracentral sulcus. Red foci in the 3D reconstruction (top right) include both core and edema. Imaging was performed in the immediate postoperative period, within hours to days following ablation.

