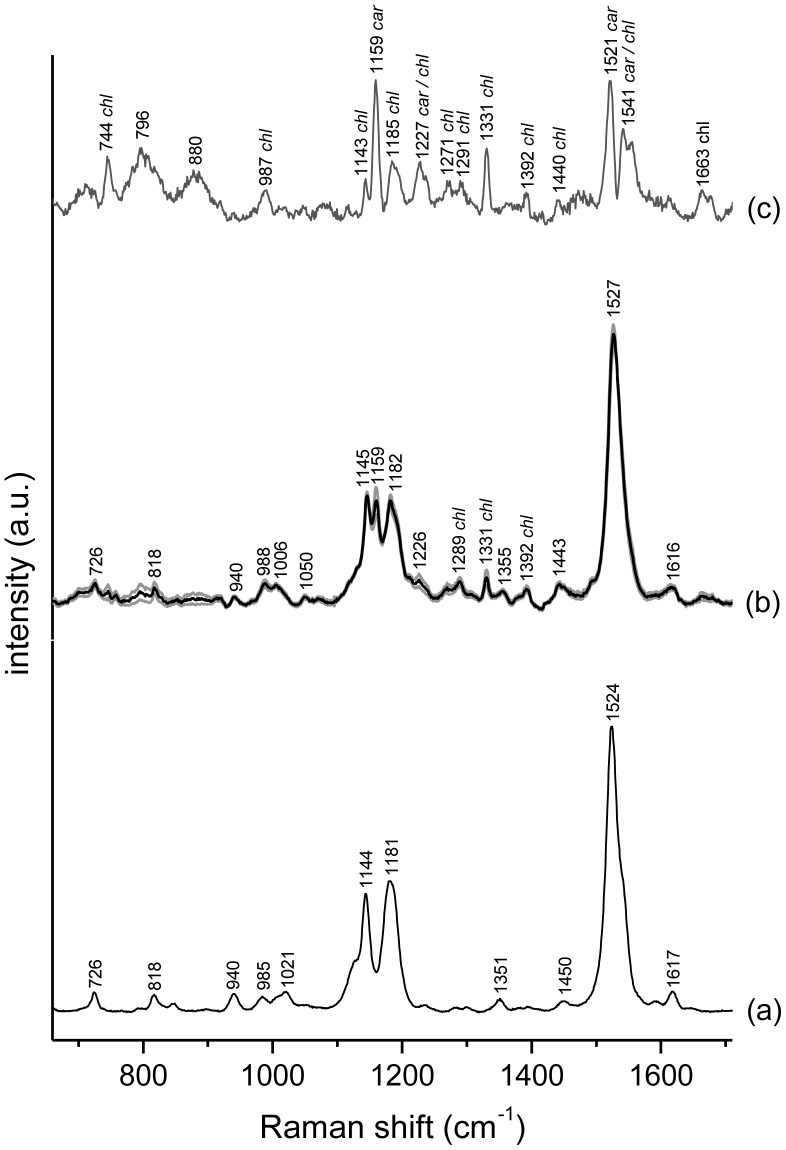
Figure 8. Raman spectra of peridinin and living O. cf. ovata cells.
400–1800 cm-1 region of (a) the Raman spectrum of peridinin (solid); (b) average normalized Raman spectrum (in black) plus and minus the intensity S.D. (in grey) of a set of 24 spectra collected from 24 different O. cf. ovata cells; (c) S.D. of the Raman intensity for the same set of 24 cells, plotted with a magnified intensity scale. In all spectra, bands are labelled with their Raman shift. In (b) and (c) bands assigned to chlorophyll are labelled as chl, whereas in (c) bands assigned to carotenoids are labelled as car. Excitation wavelength 785 nm.

