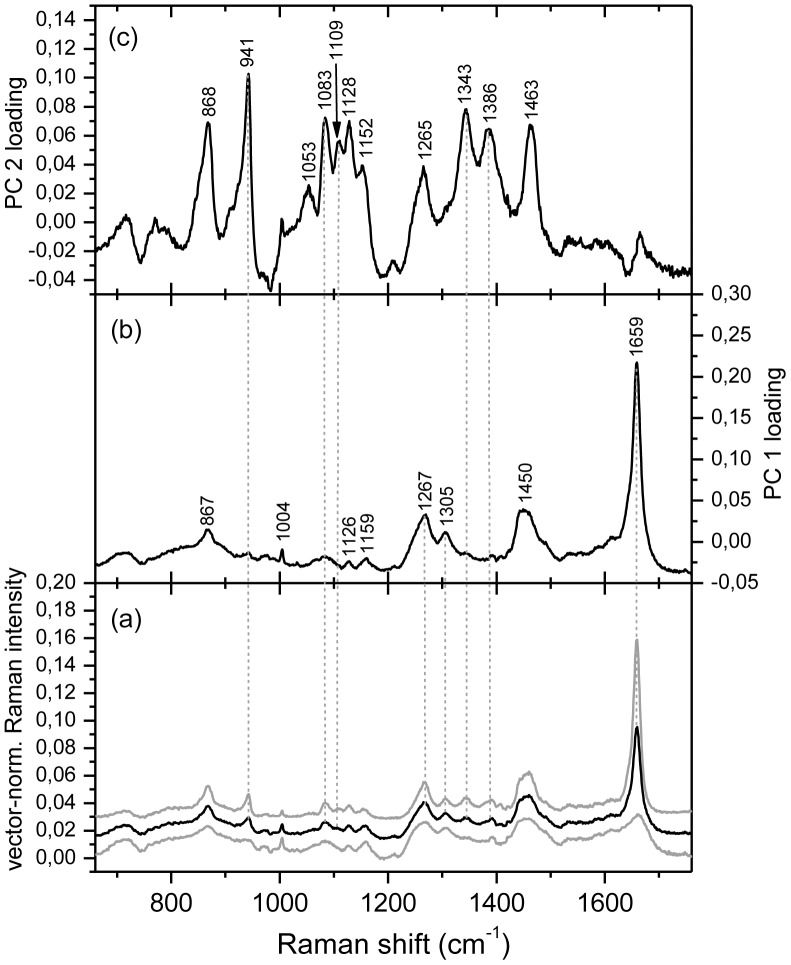
Figure 10. Raman spectra of a map of a fixed and depigmented O. ovata cell in the exponential phase.
(a) average (in black) and st.dev. (in grey) of the vector-normalized Raman spectra of a map of a fixed and depigmented O. cf. ovata cell in the exponential phase consisting of 1681 (41×41) spectra (see Fig. 11); (b) loadings for the first principal component PC 1 and (c) loadings for the second principal component PC 2. Excitation wavelength 785 nm.

