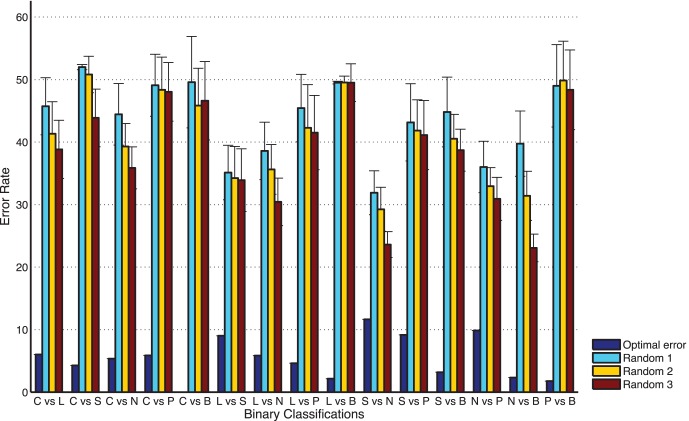
Figure 3. Comparisons of error rate (percentage of misclassified samples) over 50 runs of randomization analysis.
Random 1: selecting randomly features subsets from original features, whose size is one-forth of the number of optimal features; Random 2: one half of the number of optimal features; Random 3: equal to the number of optimal features.

