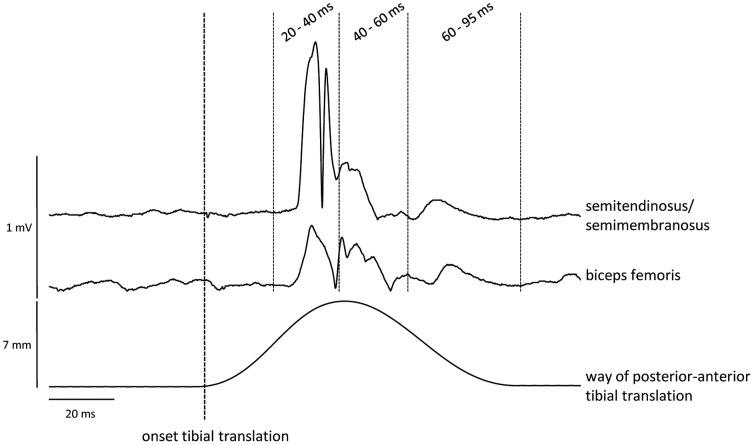
Figure 2. EMG and tibial translation data from one representative subject.
EMG activity of biceps femoris and semitendinosus/semimembranosus as well as posterior-anterior tibial translation of one subject. In the figure, EMG data is rectified in order to visualize the different parts of the hamstring stretch reflex. The vertical bold line indicates the onset of posterior-anterior tibial translation. Three different time intervals were analyzed (20–40, 40–60 and 60–95 ms).

