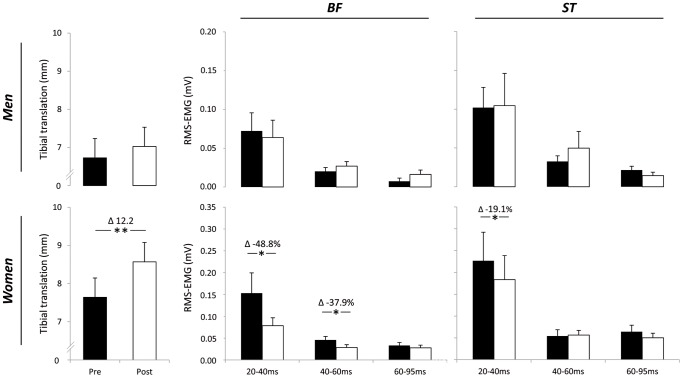
Figure 3. Effect of fatigue on tibial translation (left) and reflex responses (middle and right).
Filled bars: Pre, open bars: Post, BF: biceps femoris, ST: semitendinosus/semimembranosus. Data are displayed as means ± standard error of the mean. * denotes a significant difference compared to the pre-measurement, * P≤0.05; ** P≤0.01.

