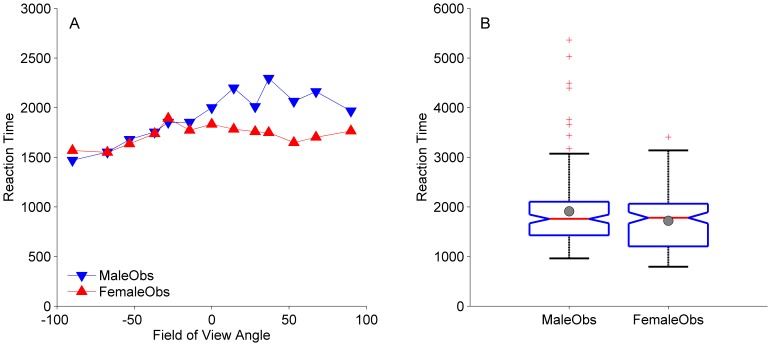
Figure 2. Reaction time as a function of perspective cue and boxplots for male and female observers.
Data of 11 females and 11 males. A. Mean reaction times generally increase as a function of field of view angle. The clearer the point-light figure is facing the viewer (strongly negative field of view angles), the quicker observers are to respond. The increase in reaction time as a function of field of view angle saturates or even reverses to a slight decrease for walkers carrying perspective cues that convincingly signal the walker to be ‘facing away’. It appears as if female observers have shorter response times than male observers, mainly for figures containing ‘facing away’ perspective cues. B. The box plots, however, clarify that the somewhat larger mean for male compared to female observers (grey circles) resulted from outliers (red crosses) in the data of the male observers. The red horizontal lines in the middle of the boxes indicate the median. The bottom of the box indicates the 25 th percentile. The top of the box represents the 75 th percentile. The T-bars or whiskers extend to 1.5 times the height of the box or, if no observation has a value in that range, to the minimum or maximum values. The notches of the box plots (triangles pointing inwards), indicating the 95% confidence interval around the median, overlap: Median reaction times of male and female observers do not differ.

