
Figure 5. SEM images of SCs on PHB(50)/PHBV(50) random (R) and aligned (A) nanofibers.
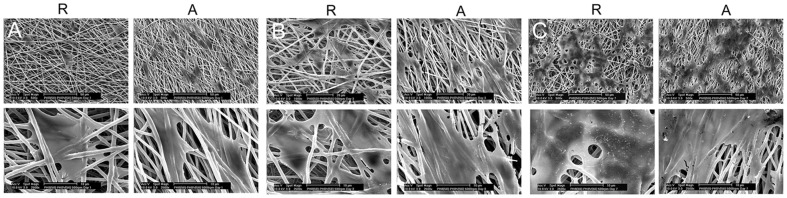
(A) 1 day, (B) 3 days, and (C) 7 days after cell seeding. Scale bars represent 50 µm for top and 10 µm for button pictures, respectively.
Official websites use .gov
A
.gov website belongs to an official
government organization in the United States.
Secure .gov websites use HTTPS
A lock (
) or https:// means you've safely
connected to the .gov website. Share sensitive
information only on official, secure websites.
(A) 1 day, (B) 3 days, and (C) 7 days after cell seeding. Scale bars represent 50 µm for top and 10 µm for button pictures, respectively.