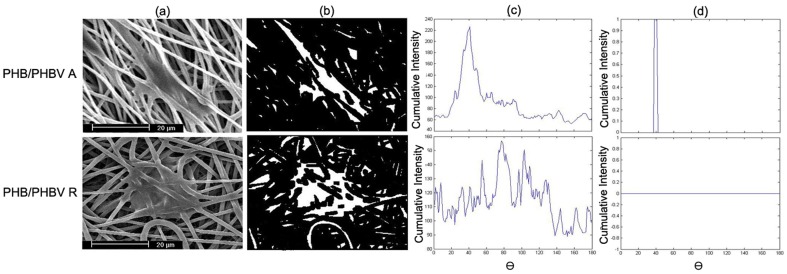
Figure 6. Image processing algorithms on SEM images of cultured SCs on PHB(50)/PHBV(50) random (PHB/PHBV R group) and PHB(50)/PHBV(50) aligned (PHB/PHBV A group) nanofibrous scaffolds.
(A) Original SEM image of SCs on scaffold after 1 day of cell culture; (B) binary image showing the processing output of nonlinear diffusion filtering; (C) Radon transform results of binary image for a range of [0,180°] and with a resolution of  θ = 1°; (D) dominant peak of the maximum of Radon transform matrix.

