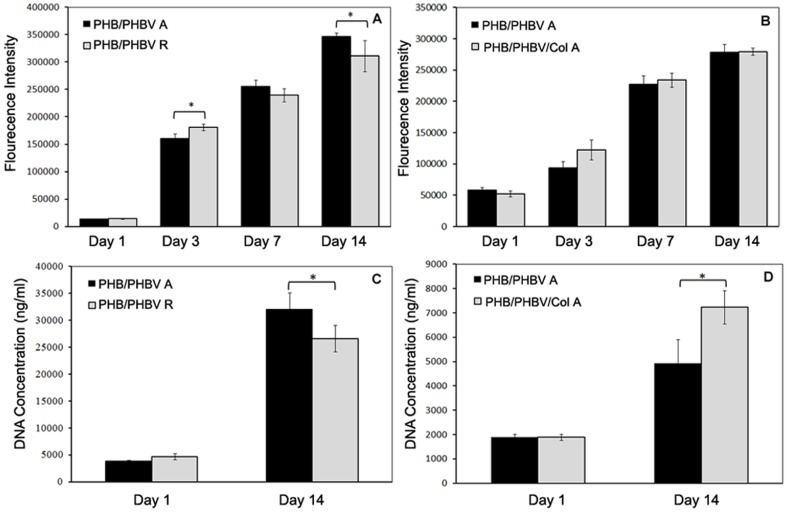
Figure 8. Alamar blue and DNA quantification assay results to compare metabolic activity and proliferation of SCs.
(A, C) PHB(50)/PHBV(50) random nanofibers (PHB/PHBV R group) and PHB(50)/PHBV(50) aligned nanofibers (PHB/PHBV A group); (B, D) PHB(50)/PHBV(50) aligned nanofibers (PHB/PHBV A group) and PHB(45)/PHBV(45)/collagen(10) aligned nanofibers (PHB/PHBV/Col group) during 14 days of culture. Asterisks represent significant difference at p≤0.05.

