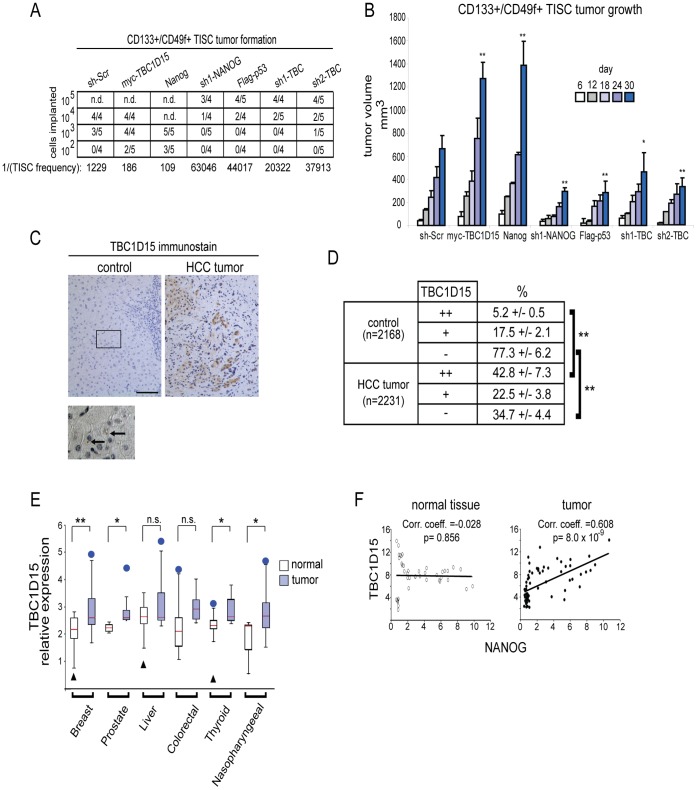
Figure 5. Oncogenic function of TBC1D15.
(A) Tumor initiation titration. Defined numbers of TISCs stably expressing the indicated transgenes or lentivirus shRNAs were implanted subcutaneously into the dorsal hind flanks of NOG mice and tumor growth monitored for 60 days. Tumors greater than 25 mm3 and which exhibited growth progression during the course of the study were scored as positive. (B) Tumor growth kinetics. TISCs (5× 10⁴) were implanted subcutaneously into NOG mice as in (A) and tumor volumes were measured on the indicated days. At least 6 tumors were measured for each cell line examined. (C) TBC1D15 expression in HCC patient tissue specimens. Tumors and matched, non-cancerous control tissues were processed by sectioning and immunostained using TBC1D15 antibody, then counterstained with hematoxylin to indicate cell nuclei. Below, high magnification image showing punctate localization of TBC1D15 (arrows) in noncancerous control tissue. Scale bar, 50 μm. (D) Stained tissues from patient specimens were scored for the degree of TBC1D15 immunopositivity. Brackets indicate statistically significant (**P<0.01) comparisons between groups. The number of total cells scored across all samples (n = 17) is indicated for each group. (E) Box plot showing the expression of TBC1D15 in diverse tumor types and matched normal tissues. Red line indicates the median, box edges the 25–75 percentiles. Whiskers represent 1.5×interquartile range (IQR) above the third quartile or below the first quartile. Outliers (blue circles or black triangles) are shown when outside this range. (F) Scatter plots showing results from meta-analysis comparing the expression levels of TBC1D15 and NANOG across multiple tumor samples and in matched, non-tumor control tissues.

