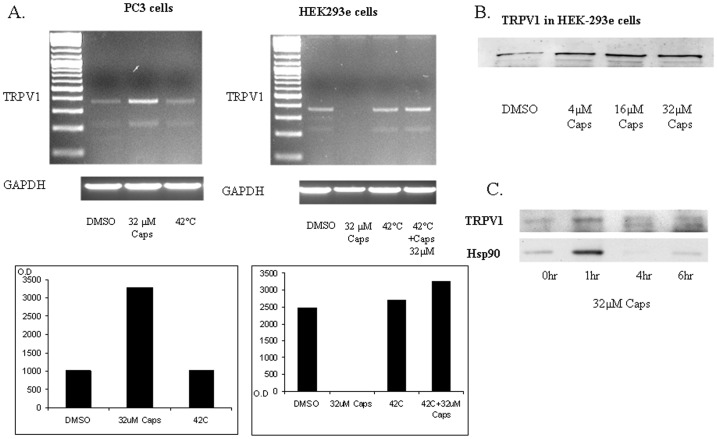
Figure 2. TRPV1 mRNA and protein abundances in HEK-293e cells.
A. Semi-quantitative RT-PCR for TRPV1. Upper left panel: mRNA levels from PC3 prostate cancer cells: non treated cells, cells treated with 32 µM capsaicin for 1 hr and cells treated with heat shock at 42°C for 3 hrs. Lower right panel: mRNA levels of GAPDH as well as densitometric. Upper right panel: mRNA levels from HEK-293e cells: non treated cells, cells treated with 32 µM capsaicin for 1 hr (Caps), cells treated with heat shock at 42°C for 3 hrs, and cells treated with heat shock at 42°C for 3 hrs with the addition of 32 µM capsaicin. Lower right Panel: mRNA levels of GAPDH as well as densitometry. B. Representative immunoblot analysis of TRPV1 abundance. TRPV1 was detected in HEK-293e cells. Cells in culture were incubated with 0.01% DMSO or treated with 4 µM, 16 µM or 32 µM of capsaicin for 1 hr. C. Representative immunoblot analysis of TRPV1 and Hsp90 abundances in HEK-293e cells. Cells were treated with 32 µM capsaicin for 0 hr, 1 hr, 4 hrs and 6 hrs.

