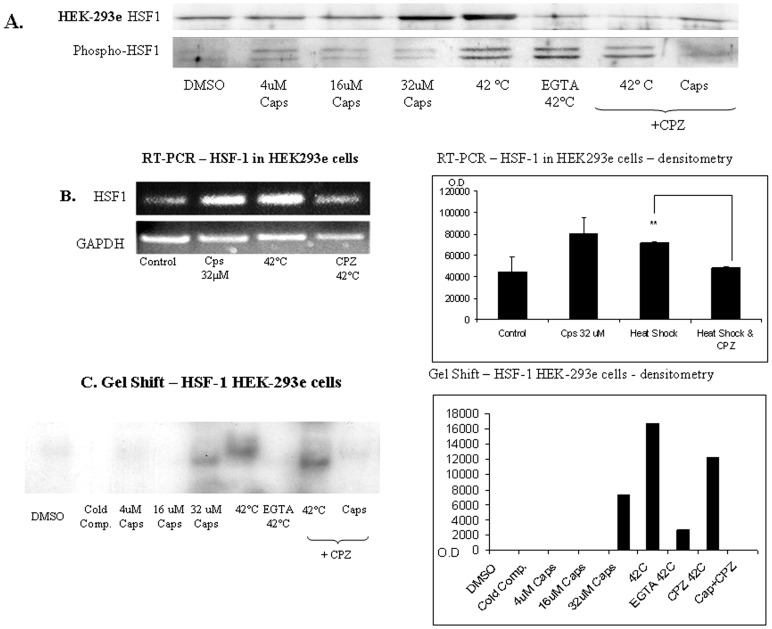
Figure 3. Capsazepine inhibits HSF-1 expression and nuclear translocation.
A. Representative immunoblot analysis of nuclear HSF-1 and phospho-HSF-1 abundances. Intra-nuclear HSF-1 and Phospho-HSF-1 were detected in HEK-293e cells. Cells were incubated with 4 µM, 16 µM or 32 µM of capsaicin for 1 hr. HEK-293e cells were treated as indicated with heat shock at 42°C for 3 hrs, heat shock at 42°C for 3 hrs with the addition of 5 mM EGTA, heat shock at 42°C for 3 hrs with the addition of 100 µM capsazepine or 100 µM capsazepine with the addition of capsaicin. B. Semi-quantitative RT-PCR for HSF-1. Upper panel: mRNA levels from non treated HEK293e cells (control), cells treated with 32 µM capsaicin for 1 hr (Caps), cells treated with heat shock at 42°C for 3 hrs, cells treated with heat shock at 42°C for 3 hrs with the addition of 100 µM capsazepine. Lower Panels: GAPDH mRNA levels from HEK293e cells as indicated above as well as densitometric analysis (Right panel). C. Electrophoretic mobility shift assay for HSF-1 DNA binding activity. Nuclear protein isolated from HEK-293e cells treated with 4 µM, 16 µM or 32 µM of capsaicin for 1 hr. Cells treated as indicated with heat shock at 42°C for 3 hrs, heat shock at 42°C for 3 hrs with the addition of 5 mM EGTA, heat shock at 42°C for 3 hrs with the addition of 100 µM capsazepine or 100 µM capsazepine with the addition of capsaicin. 10 µg of nuclear protein incubated for 20 min at room temperature with a 32P-labeled double-stranded DNA oligonucleotide containing a consensus –HSF-1 binding site. Right panel indicates densitometric analysis.

