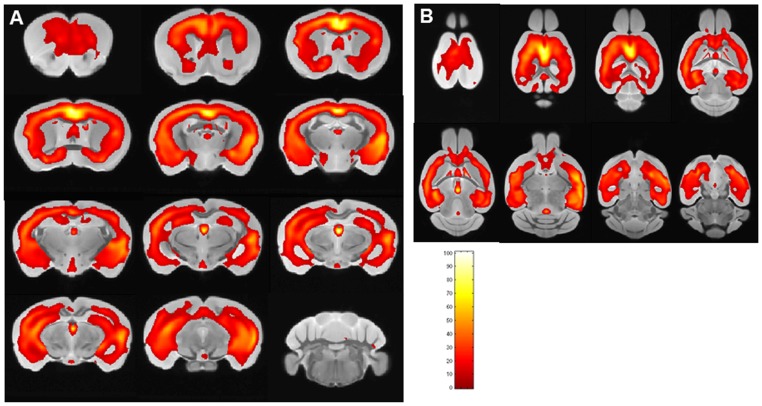
Figure 7. Shows areas of the brain are shown which differed by voxel-based analysis of ex vivo μMRI comparing USPIO-PEG-Aβ1-42 injected APP/PS1 Tg mice (n = 12) and APP/PS1 Tg mice (n = 12) injected with USPIO alone (p<0.01).
The regions of differences mirror the distribution of amyloid plaques histologically, being mainly in the cortex and hippocampus. Color bar units are the T-score. A shows areas which are significantly different in coronal sections, while B shows areas which are significantly different in horizontal sections.

