
Figure 4.
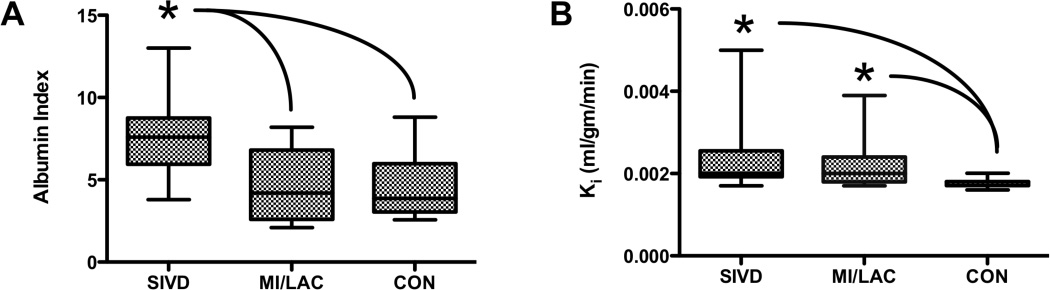
A) Qalb for the different diagnostic categories are shown; SIVD was significantly increased over MI/LAC and CON (p<0.05). B) Mean white matter permeability, Ki, was significantly higher for the SIVD and MI/LAC groups than the controls (CON), but no differences were seen between SIVD and MI/LAC. Asterisks indicate a significant difference by nonparametric ANOVA (p<0.05).