
Fig. 3.
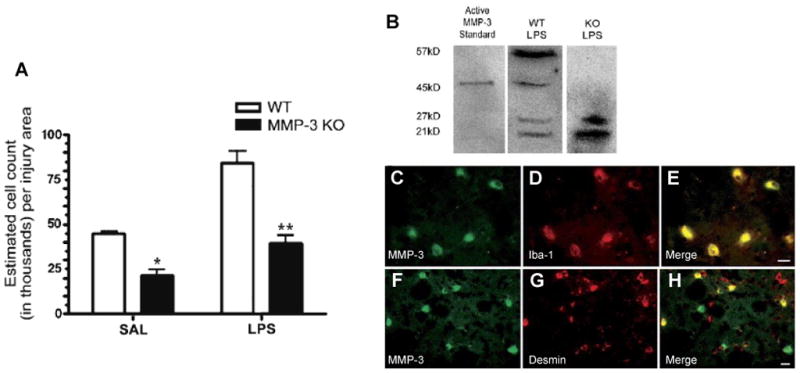
(A) Stereology for neutrophil counts 24 h after LPS or saline injection. Counts of MPO-immunoreactive neutrophils were greater in the LPS-injected caudate for both WT and MMP-3 KO. However, in the MMP-3 KO, there were significantly fewer neutrophils in the caudate than in WT in both saline and LPS-injected hemispheres (*P < 0.01, **P < 0.001; n = 4 for both WT and KO). Panels B–H: Western blotting and immunohistochemical staining for MMP-3, pericytes, and microglia. (B) Western blotting for MMP-3 showed the proform at 57 kDa and the active form at 45 kDa along with two lower, unidentified bands. The MMP-3 KO mouse did not show the 57 or 45-kDa bands of MMP-3. (C–E) MMP-3 colocalized with Iba-1-immunoreactive microglia/macrophages. (C) MMP-3 staining in LPS-injected WT; (D) Iba-1 immunostaining; (E) merged image of C and D. (F–H) MMP-3 was also seen in pericytes stained for desmin in LPS-injected WT. (F) MMP-3 staining; (G) Pericyte staining; (H) merged composite of panels F and G. Scale bars are 10 μm. Adapted from Gurney et al., 2006.