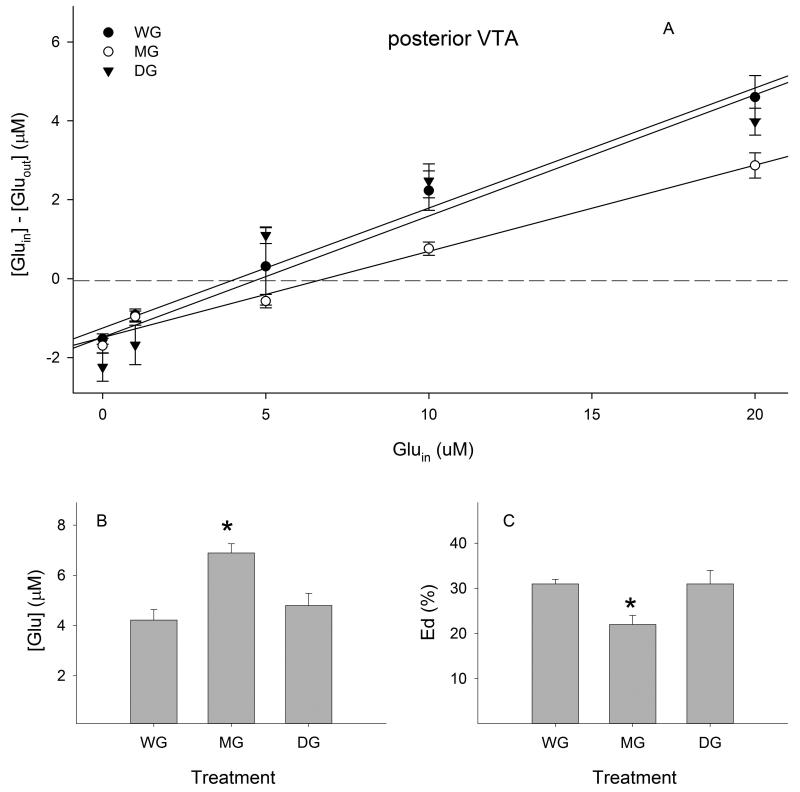
Figure 3.
Effects of ethanol maintenance (MG) and deprivation (DG) on extracellular glutamate concentrations and extraction fractions (Eds) in the posterior ventral tegmental area (VTA, n= 7-8 / group). A) Linear regression plots of glutamate for the water (WG), MG and DG groups; B) extracellular glutamate concentrations determined from points of no-net-flux in each group; C) Ed values of glutamate determined from the slope of the plots for the linear regression analysis in each group. * p < 0.05, significantly different from the WG group.

