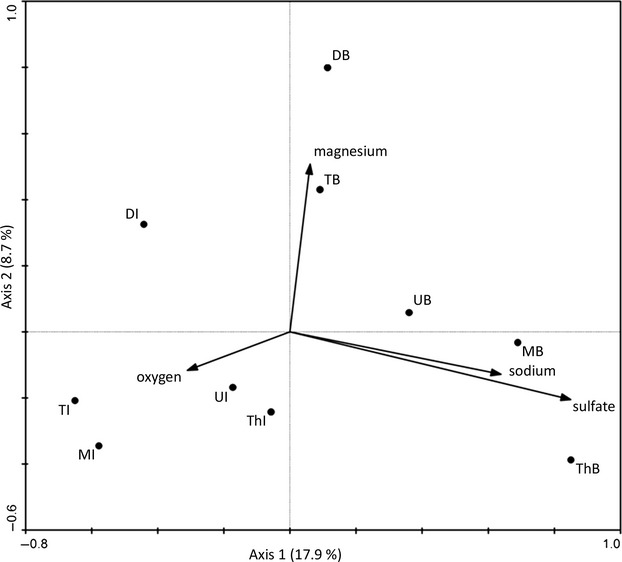
Figure 3.

Canonical correspondence analysis (CCA) of T-RFLP profiles (including T-RF size and relative abundances) for brines (B) and halocline interfaces (I) of the different sampling sites. This CCA depicts the best model in our CCAs, explaining 38% of the total variation within the T-RFLP profiles with the first two axes accounting for 27%. The first two canonical axes explained 70% of the variation of the species–environment relation. Magnesium concentration is significantly (positively) correlated with the first axis (P = 0.05). D, Discovery; M, Medee; T, Tyro; Th, Thetis; U, Urania.
