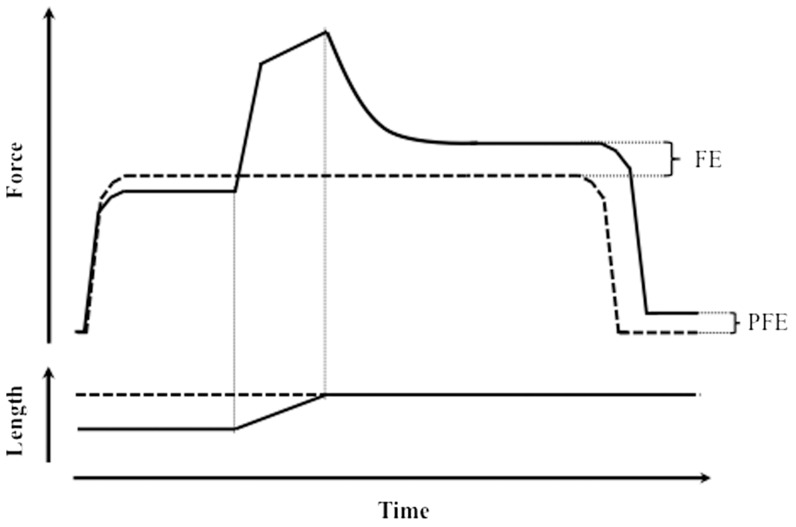
Figure 1.
Schematic representation of muscle residual force enhancement. Both panels show two representative superimposed contractions from the same muscle as it is first activated, stretched to a certain final length, relaxed (solid lines), and then isometrically activated and kept at the same final length before being relaxed again (dashed lines). Top panel: force traces. Bottom panel: length traces. FE: force enhancement. PFE: passive force enhancement.

