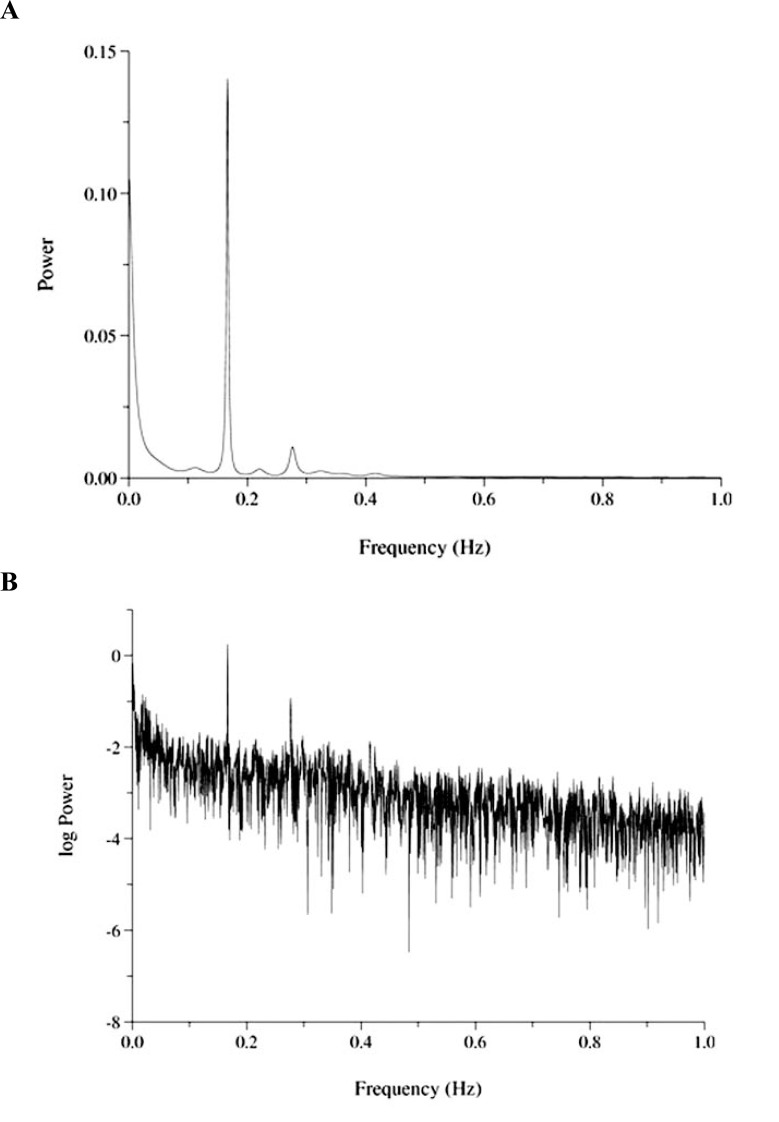
Fig. (1).
Fast Fourier transformation (FFT) of a heart rate time series (A) and its power law distribution (B).
The spectrum of the heart rate time series displays three peaks mainly at the lower frequencies (A) whereas the log transformation of the power of the signal gives rise to a more or less linear relation (B). If we apply log transformation of the frequency as well (not shown here), we will have a more smooth linear relation with a slope β. Data have been downloaded from the free-download website physionet (www.physionet.org).

