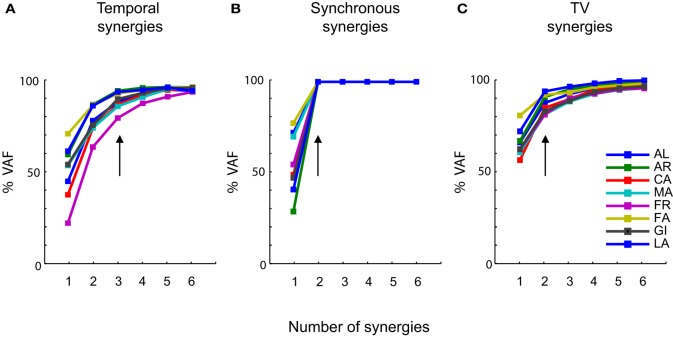
Figure 3.
Levels of approximation as a function of the number of synergies. (A) Percentage of VAF as a function of the number of temporal synergies. (B) Percentage of VAF as a function of the number of synchronous synergies. (C) Percentage of VAF as a function of the number of time-varying synergies. Each colored line is associated to a specific subject (see most right panel), which in the figure is identified by the initials of his first and last name. In all the three panels the vertical arrows indicate the number of primitives at which the curves satisfy the linear regression criterion to choose the number of primitives (see “Materials and Methods”). These points are invariant across subjects and coincide, in most of the cases, with the points at which the curves present an “elbow” and start becoming straight.

