Fig 2.

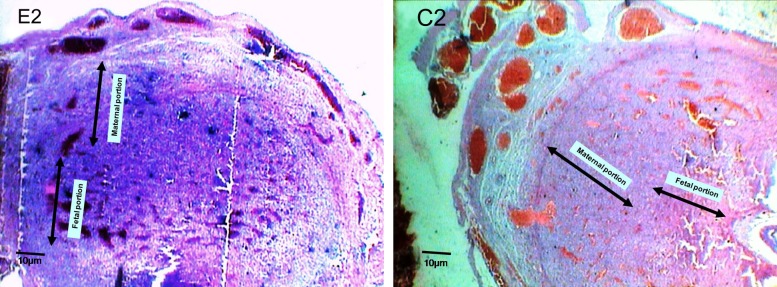
Micrograph of experimental group (E2) and control group (C2) on a 9th day old placenta, frontal section (×40). Note to the changes of thickness on fetal and maternal portions.

Micrograph of experimental group (E2) and control group (C2) on a 9th day old placenta, frontal section (×40). Note to the changes of thickness on fetal and maternal portions.