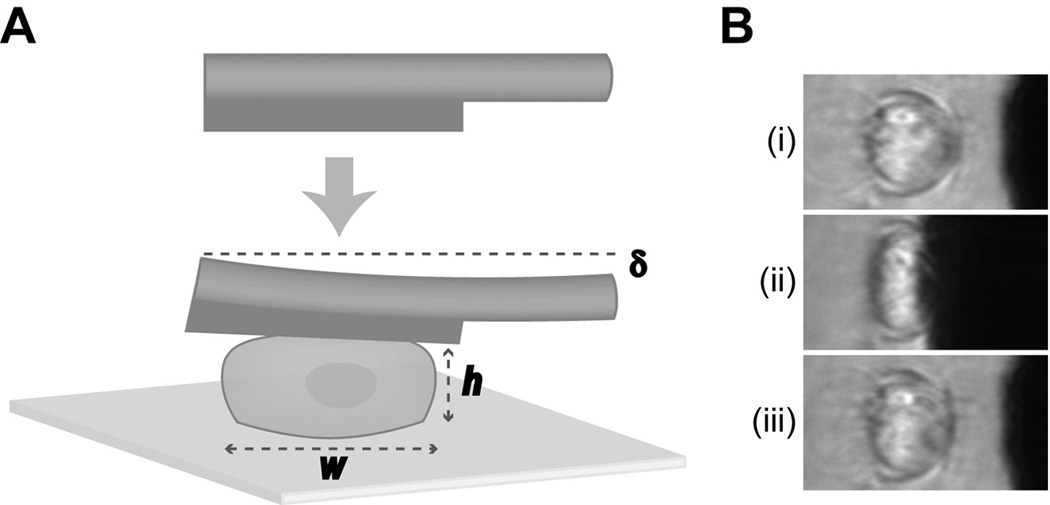
Fig. 1. Schematic of cytocompression experiments.
(A) Cells were seeded onto a glass slide and compressed at a rate of 4 µm/second by a tungsten probe. The height (h) and width (w) of the cell, as well as the probe deflection (δ) was measured at various stages of each compression event and used to calculate cellular biomechanical properties. (B) Representative frames of an inner meniscus cell seeded onto a glass slide initially (i), at equilibrium compression (ii), and during the recovery stage (iii), of a cytocompression event

