Figure 1.
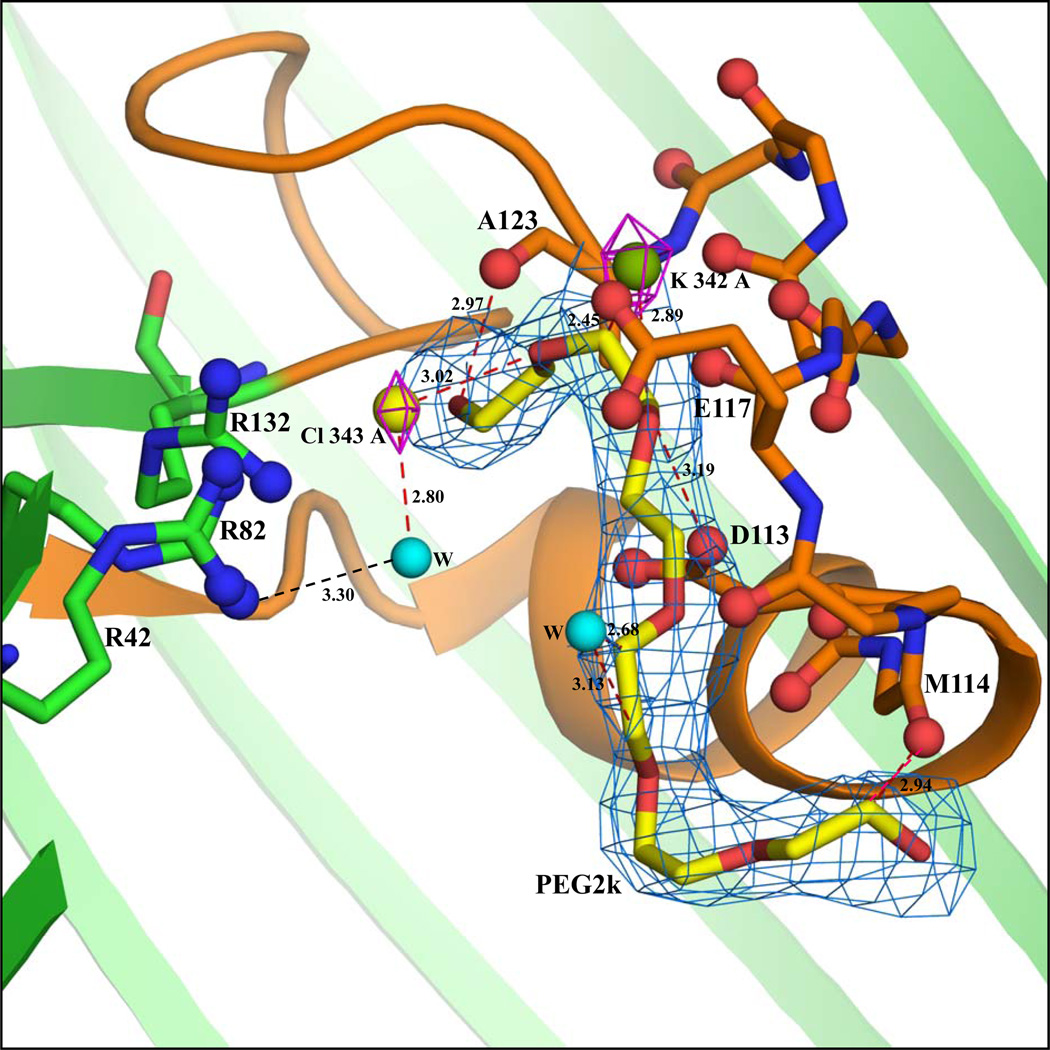
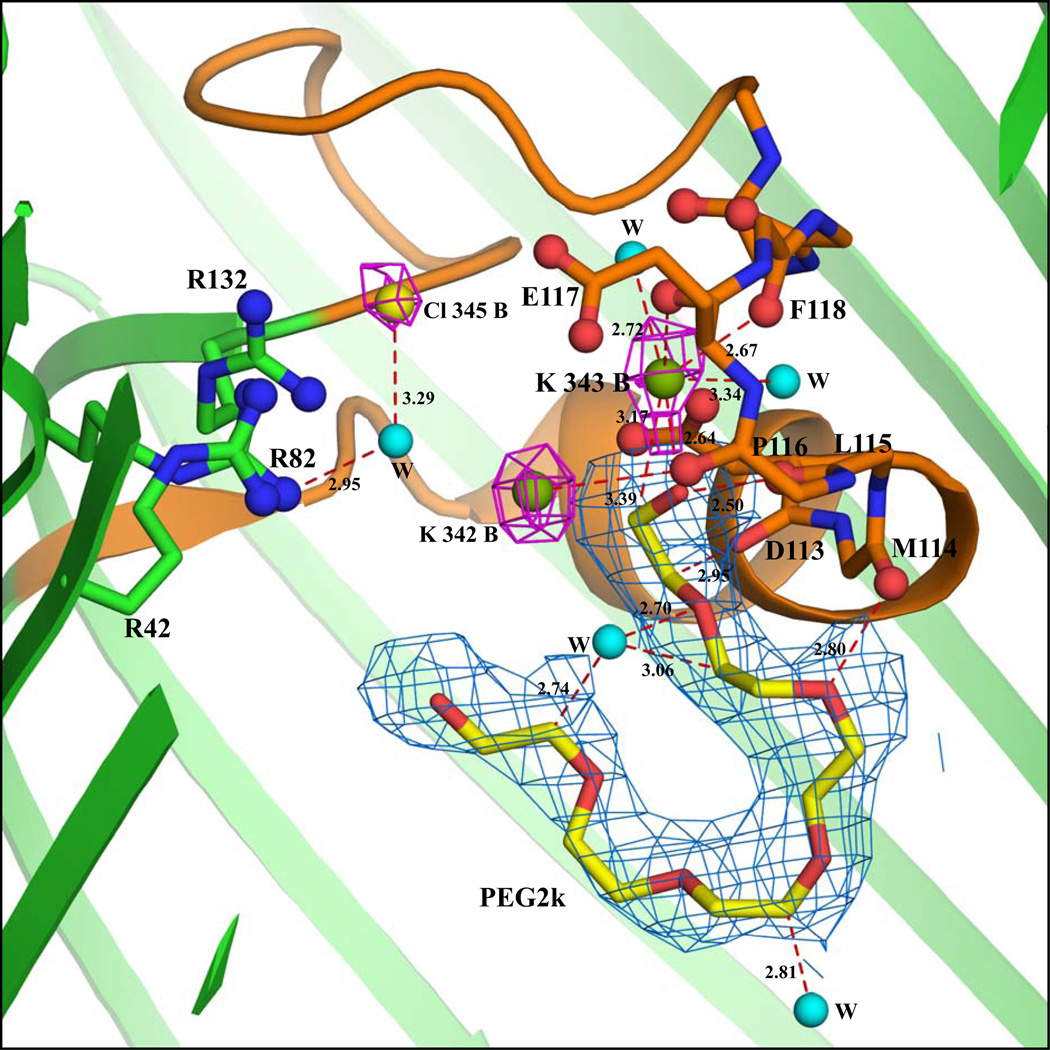
(a) Cross-sectional close-up view of the interactions inside the pore of chain A in the KCl-OmpF structure. The view is from the side with the extracellular end of the pore at the top and the intracellular end at the bottom. The protein structure is drawn in cartoon representation (green color) and the constriction zone (residues 100–131) is colored orange. The backbone atoms of residues in the loop 3 region (112–123) interacting with K, PEG and water molecules are represented by sticks and the backbone carbonyl oxygens are represented by ball and stick model. The three Arg residues (R42, R82 and R132) stacked over each other are represented by ball and stick model. The K (green sphere) and the Cl (yellow sphere) densities are shown at 3.5σ contour level in the 2Fo-Fc map (magenta). The 2Fo-Fc electron density at 0.9σ contour level for the PEG2k molecule is indicated by marine color. Water molecules are shown as cyan spheres. (b) Cross-sectional close-up view of the interactions inside the pore of chain B in the KCl-OmpF structure. A water molecule is shown as a cyan sphere (all other drawing conventions are same as in part a). The peaks were located in the Fo-Fc map using the program COOT. In this figure as the densities are observed after refinement in 2Fo-Fc map, the density is displayed at 3.5σ contour level. The 2Fo-Fc electron density diagram at 0.9σ contour level for the PEG2k molecule is indicated by marine color.


