Figure 6.
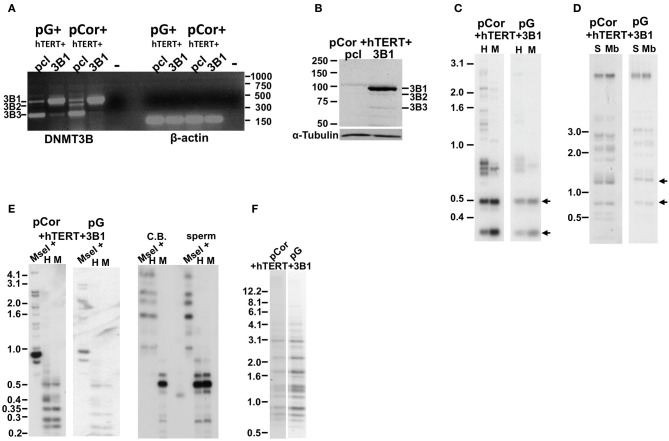
The abnormal methylation state of subtelomeric regions and other non-telomeric repetitive sequences is not rescued by human DNMT3B1 in ICF fibroblasts. (A) RT-PCR analysis of DNMT3B1 mRNA expression in immortalized pG and pCor fibroblasts introduced with either an empty plasmid as a control (pcl) or DNMT3B1 (3B1). DNMT3B has several isoforms as a result of alternative splicing. The most prevalent isoforms are: DNMT3B1 (3B1), DNMT3B2 (3B2), and DNMT3B3 (3B3). The full-length 3B1 is highly expressed only in the immortalized ICF fibroblasts that have been transduced with the full-length cDNA. Size markers in kb appear to the right of the gel. β-actin was amplified as a control. (B) Western blot analysis of DNMT3B expression in immortalized pCor fibroblasts, which were transduced with either the empty plasmid (pcl) or hDNMT3B1 (3B1). DNMT3B1 (3B1) appears clearly only in the cells introduced with the full-length isoform of DNMT3B. Size markers in KD appear on the left of the blot. α-Tubulin serves as a control for equal protein loading. (C) Methylation analysis of pCor + hTERT + DNMT3B1 and pG + hTERT + DNMT3B1 fibroblasts with the subtelomeric NBL-1 probe following digestion of DNA samples with HpaII (H) and MspI (M). Arrows point to hybridization bands in samples that are hypomethylated and therefore appear in HpaII-digested DNA in addition to MspI-digested DNA. (D) Methylation analysis of pCor + hTERT + DNMT3B1 and pG + hTERT + DNMT3B1 fibroblasts with the subtelomeric Hutel probe. DNA samples were digested with either Sau3AI (S) or MboI (Mb) and probed with the subtelomeric Hutel probe. Arrows point to hybridization bands in samples that are hypomethylated and therefore appear in Sau3AI-digested DNA in addition to MboI-digested DNA. (E) Methylation analysis of pCor + hTERT + DNMT3B1 and pG + hTERT + DNMT3B1 fibroblasts with the p1A12 probe. DNA samples were digested initially with MseI, followed by redigestion with either MspI (M) or HpaII (H) and separated on a 2% agarose gel. If the DNA is hypomethylated (as in sperm DNA), the additional digestion with HpaII produces smaller bands, as with MspI. Cord Blood (CB) DNA is methylated at 1A12 repeats. (F) Methylation analysis of pCor + hTERT + DNMT3B1 and pG + hTERT + DNMT3B1 fibroblasts with the Satellite 2 repeat probe following digestion of DNA samples with BstBI. The hypomethylated samples are visualized by the appearance of bands at the lower molecular range.

