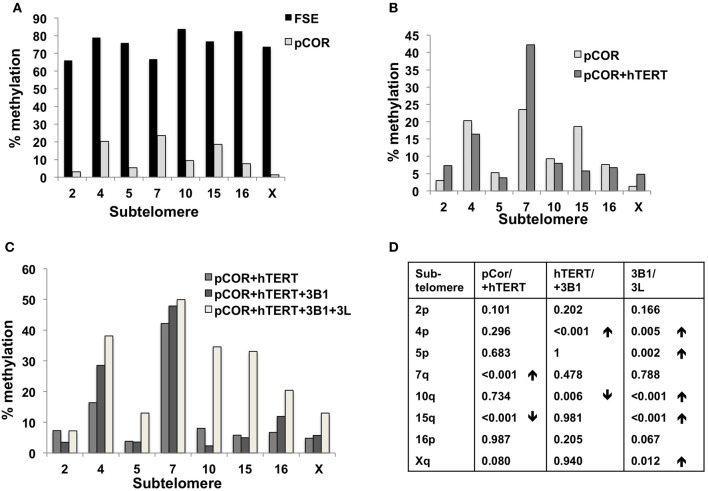
Figure 7.
Bisulfite analysis of subtelomeric methylation in ICF fibroblasts. pCor fibroblasts were subjected to bisulfite analysis at eight subtelomeric regions (2p, 4p, 5p, 7q, 10q, 15q, 16p, and Xq), within 400 bp from the respective telomeric track. Regions are depicted in graphs by chromosome number only, but refer only to the specified chromosome arm. Bisulfite analysis data appears in Figures A1–A9 and in Table A1. (A) Comparison of subtelomeric methylation levels between WT (FSE) and ICF (pCor) fibroblasts. (B) Comparison of subtelomeric methylation levels between pCor fibroblasts and pCor + hTERT fibroblasts. (C) Comparison of subtelomeric methylation levels between pCor + hTERT, pCor + hTERT + DNMT3B1 (3B1) and pCor + hTERT + DNMT3B1 + DNMT3L (3L) fibroblasts. (D) Summary of p-values obtained by a χ 2-test with Yate's correction. pCor/+hTERT: comparison of methylation percentage between pCor and pCor + hTERT, hTERT/+3B1: comparison of methylation percentage between pCor + hTERT to pCor + hTERT + DNMT3B1. 3B1/3L: comparison of methylation percentage between pCor + hTERT + DNMT3B1 and pCor + hTERT + DNMT3B1 + DNMT3L. Arrows depict whether in the cases of significant methylation-level changes the methylation percentage was elevated or reduced.

